Sell In May Go Away
May 2, 2026 12:43 am Leave your thoughtsHeaded into the weekend
As we head into the weekend of May 1, 2026, The market is in a very tricky place.
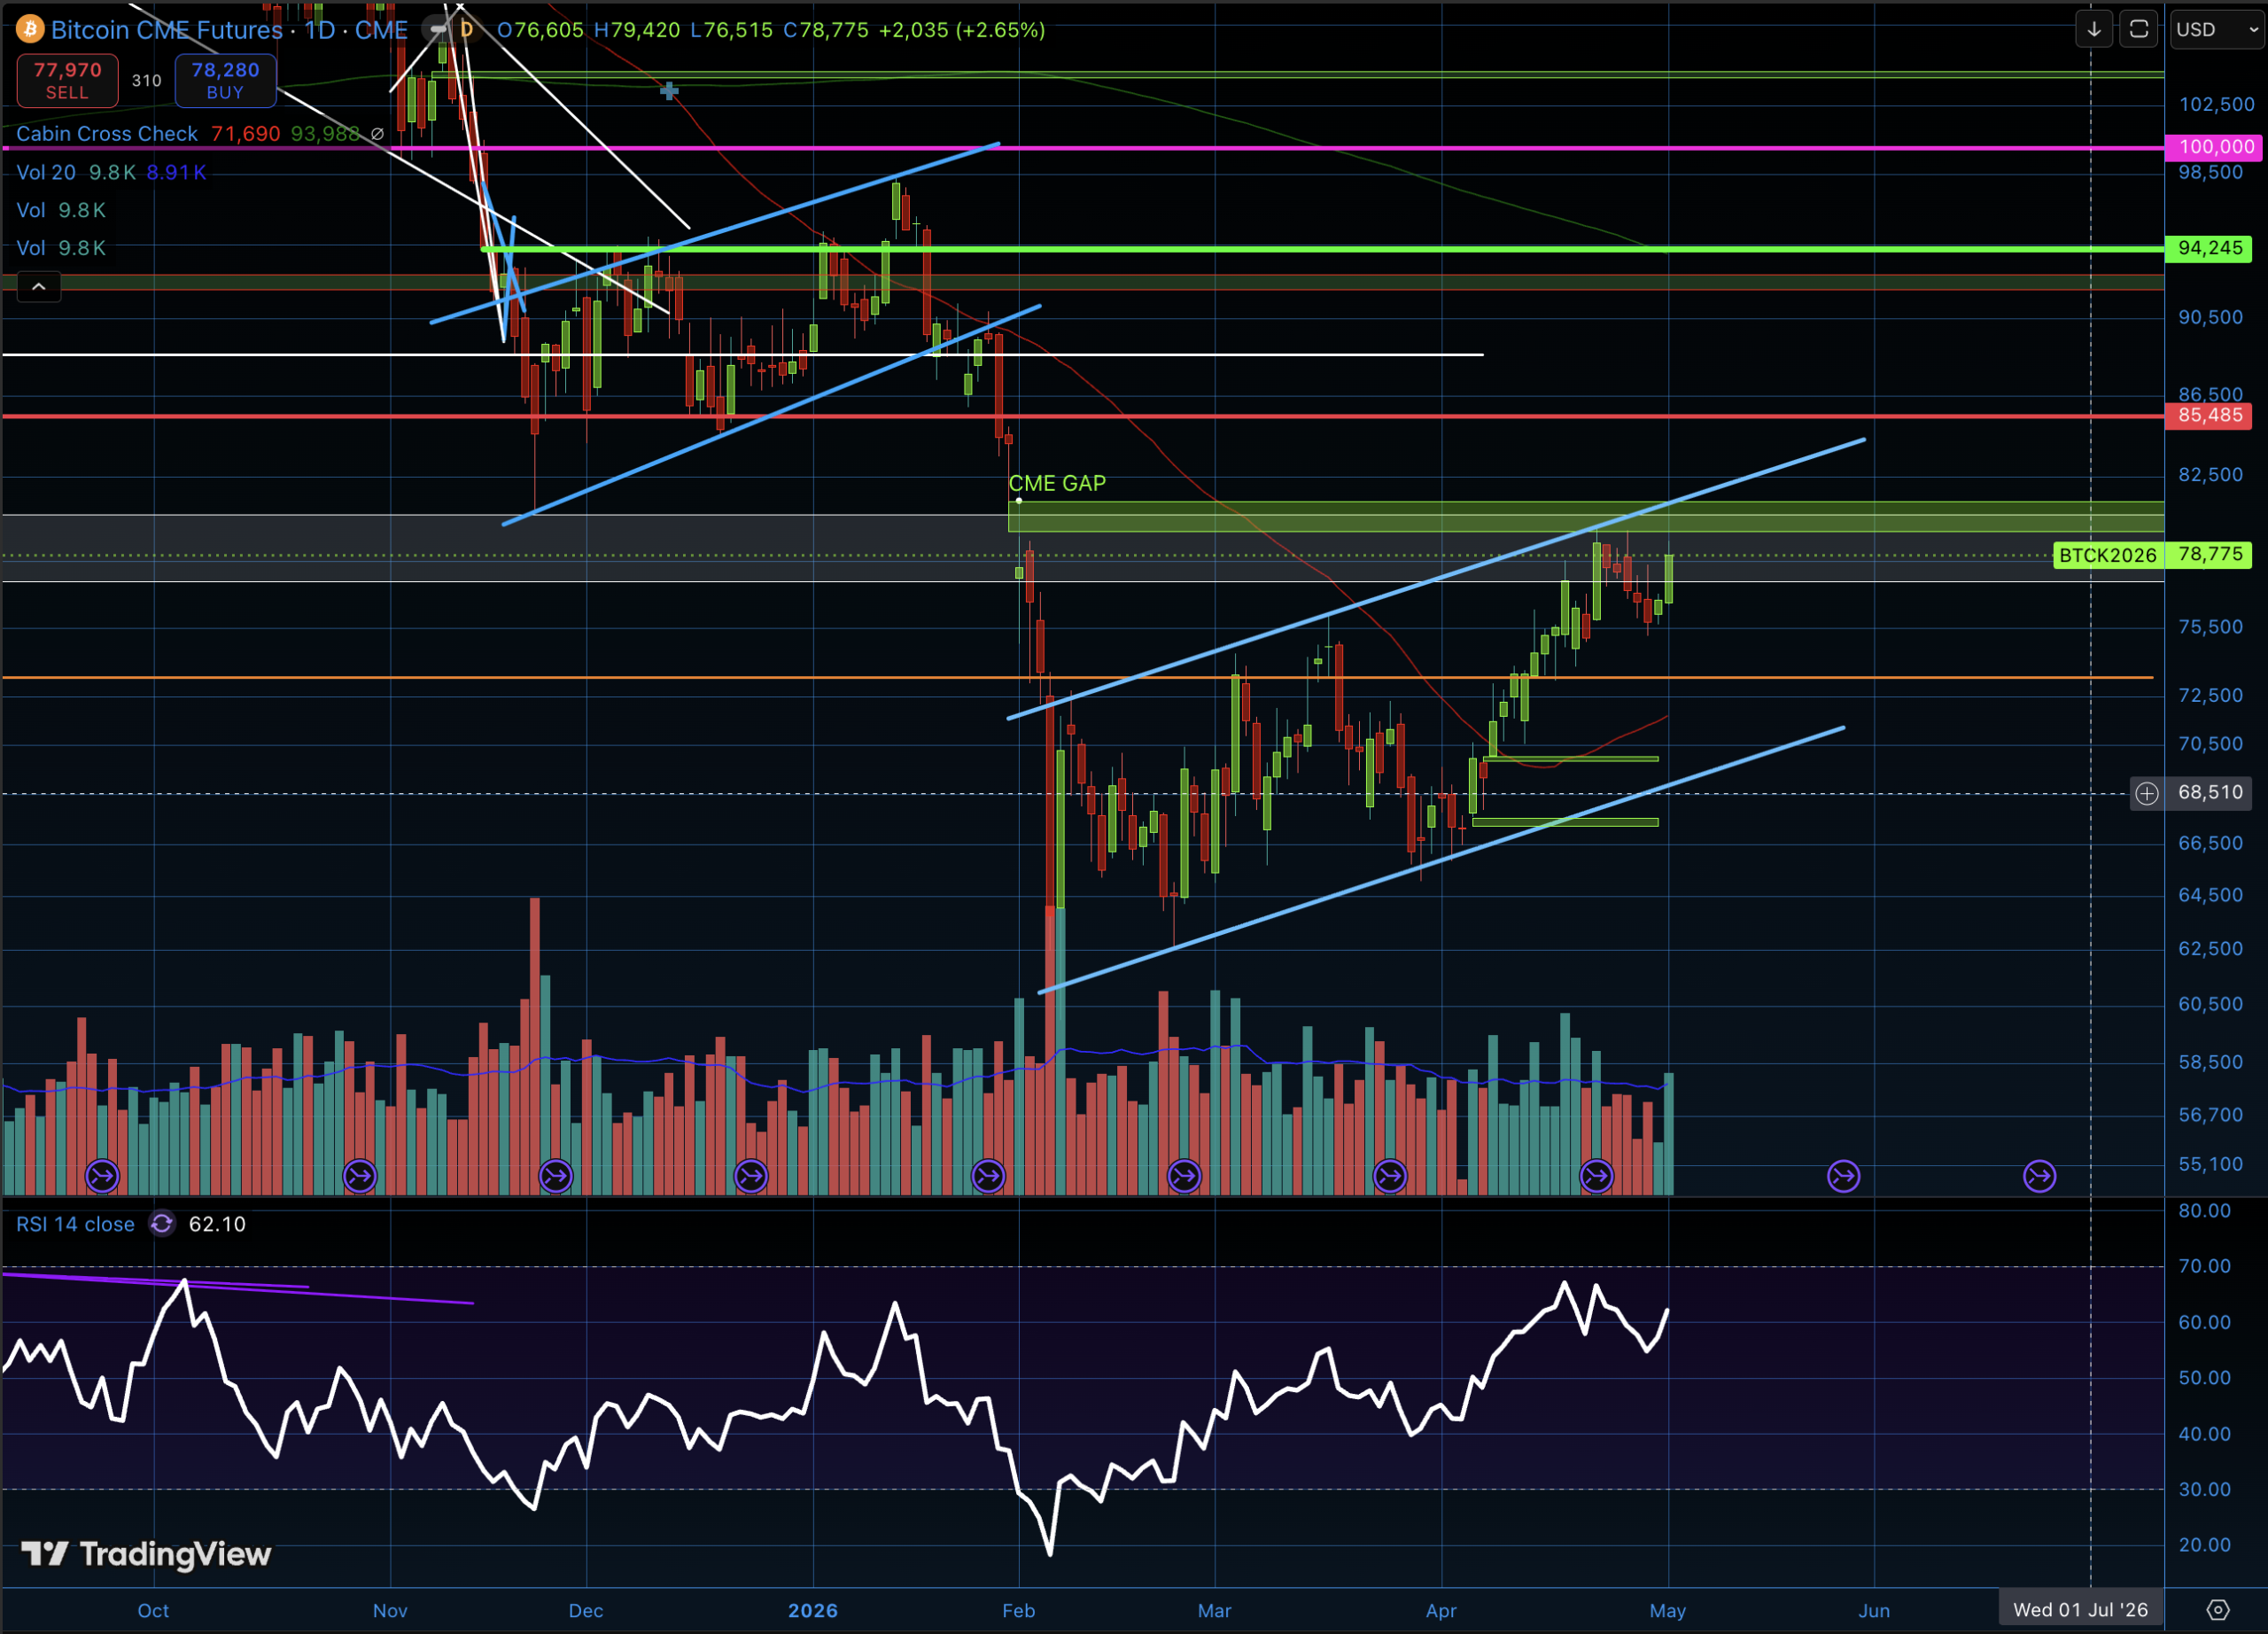
Top of The Bull Flag & CME Gap Above
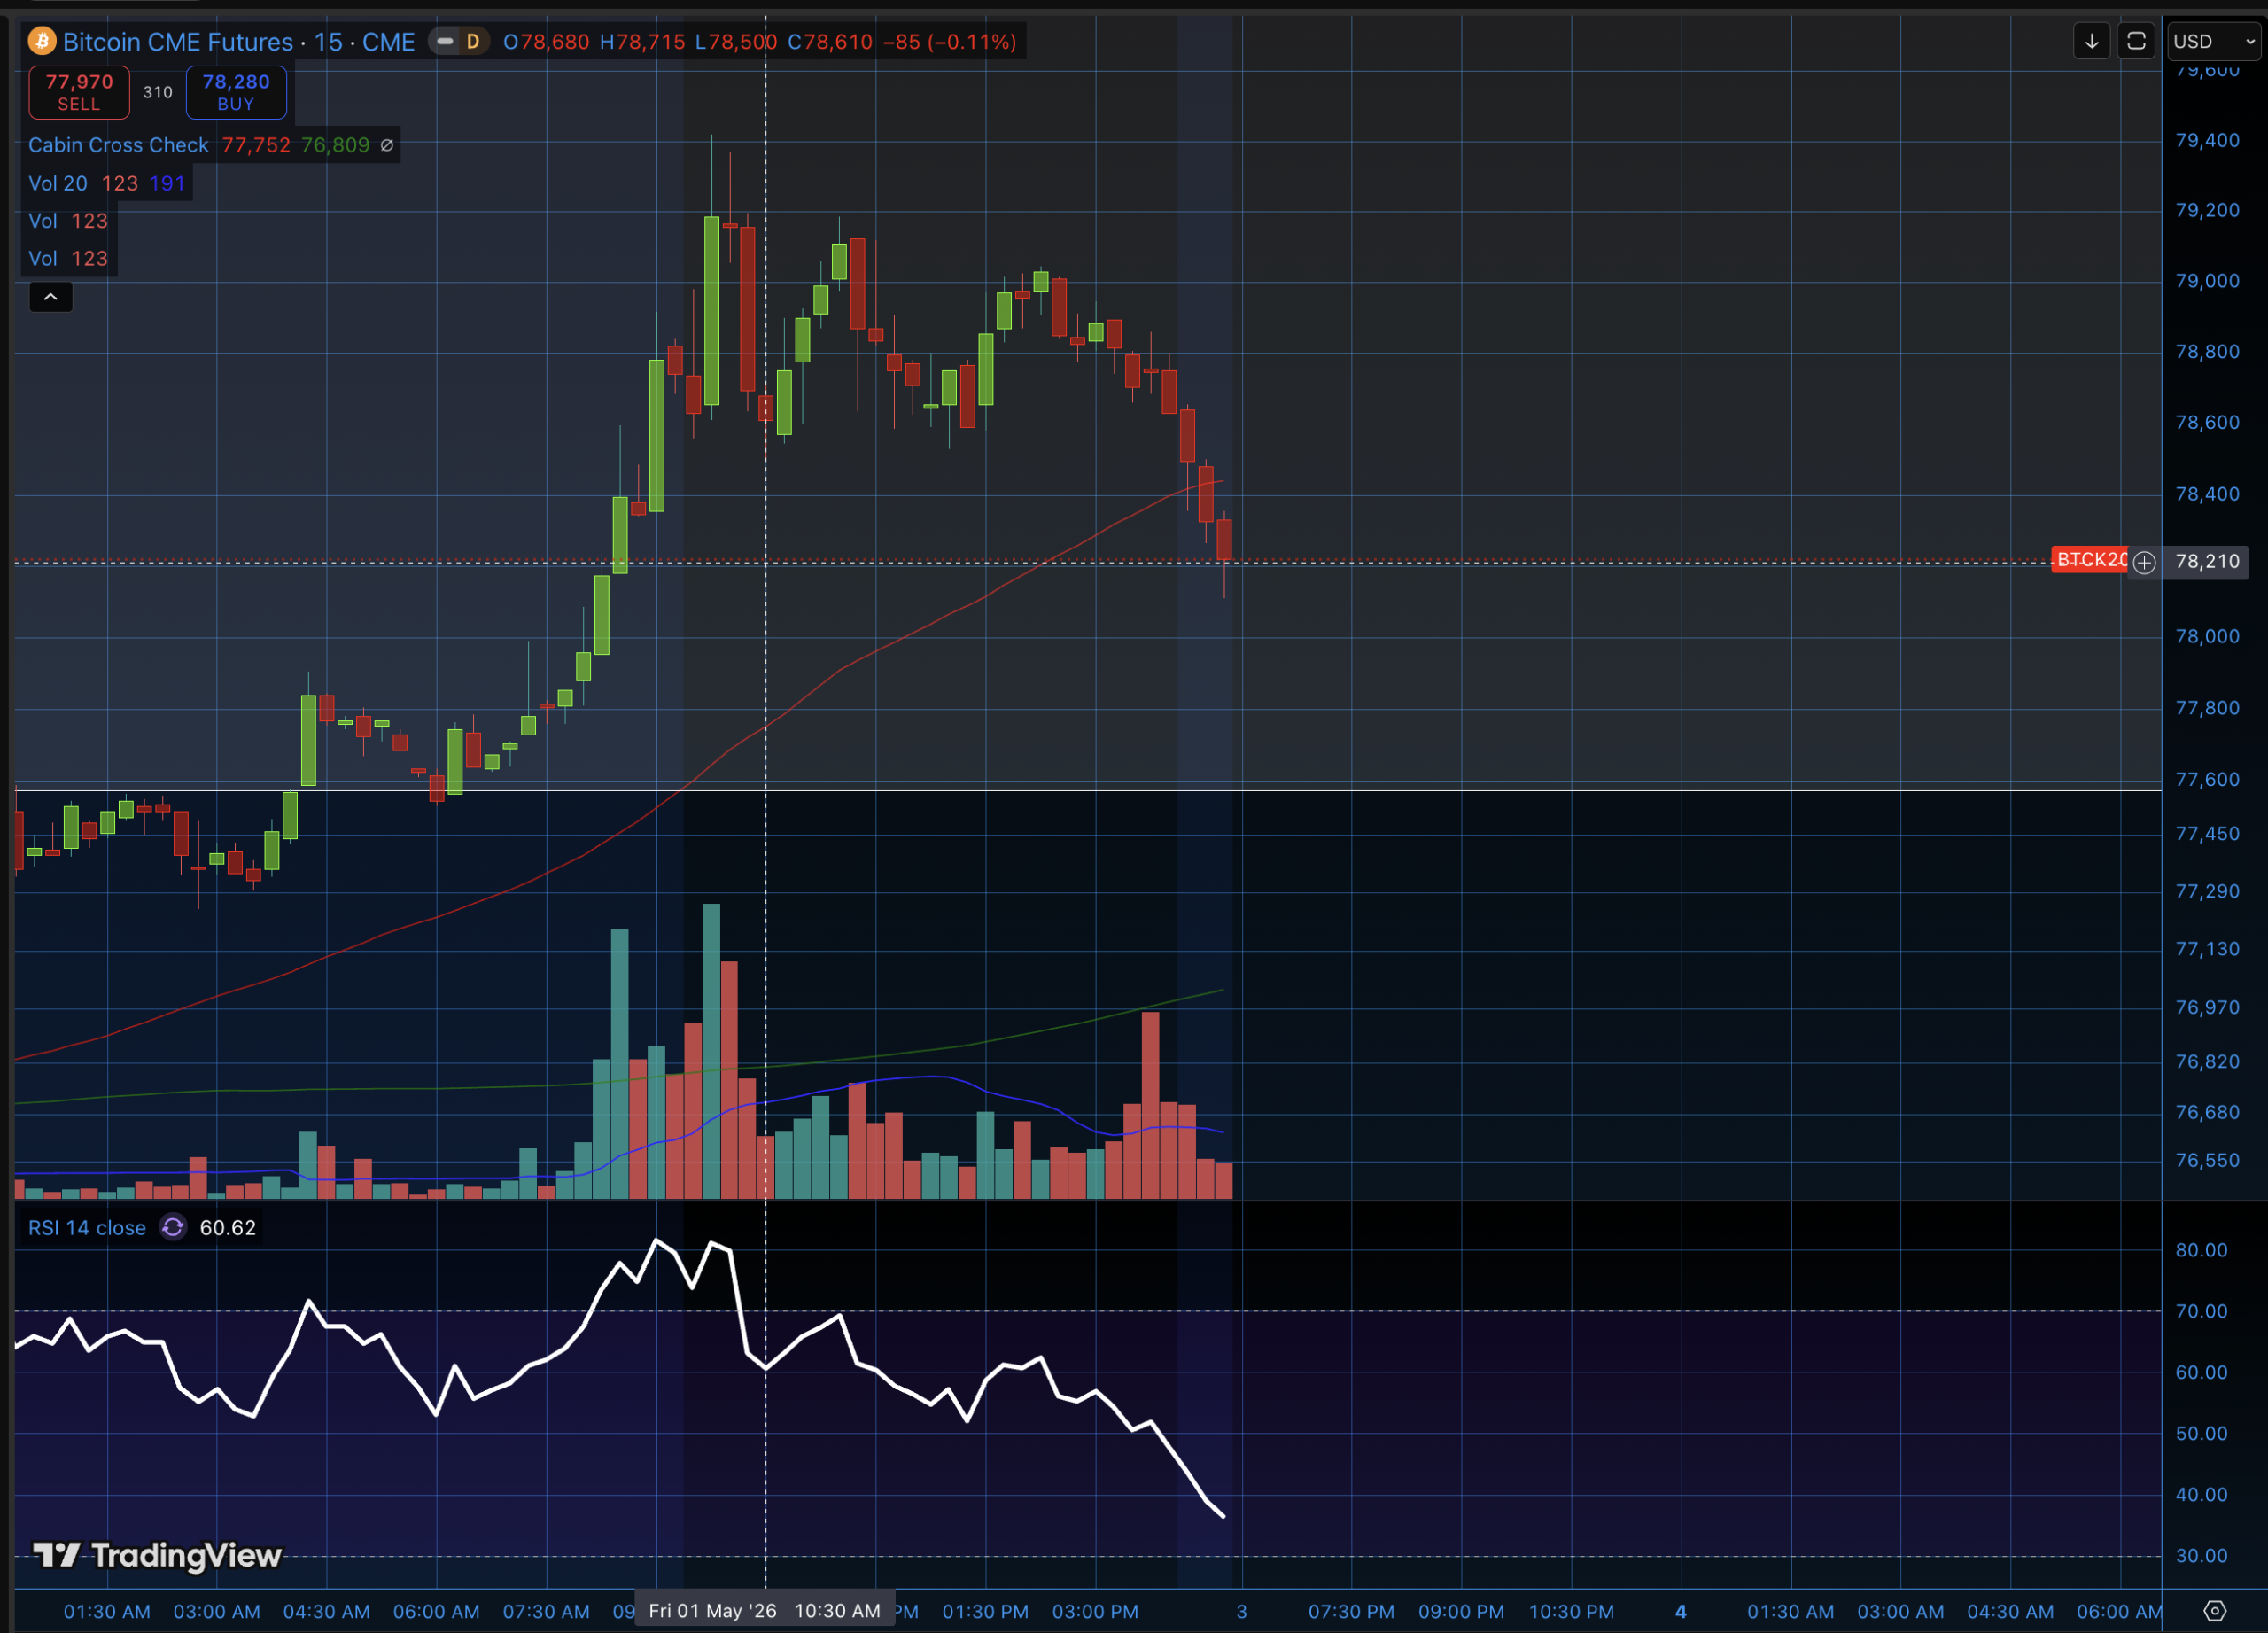
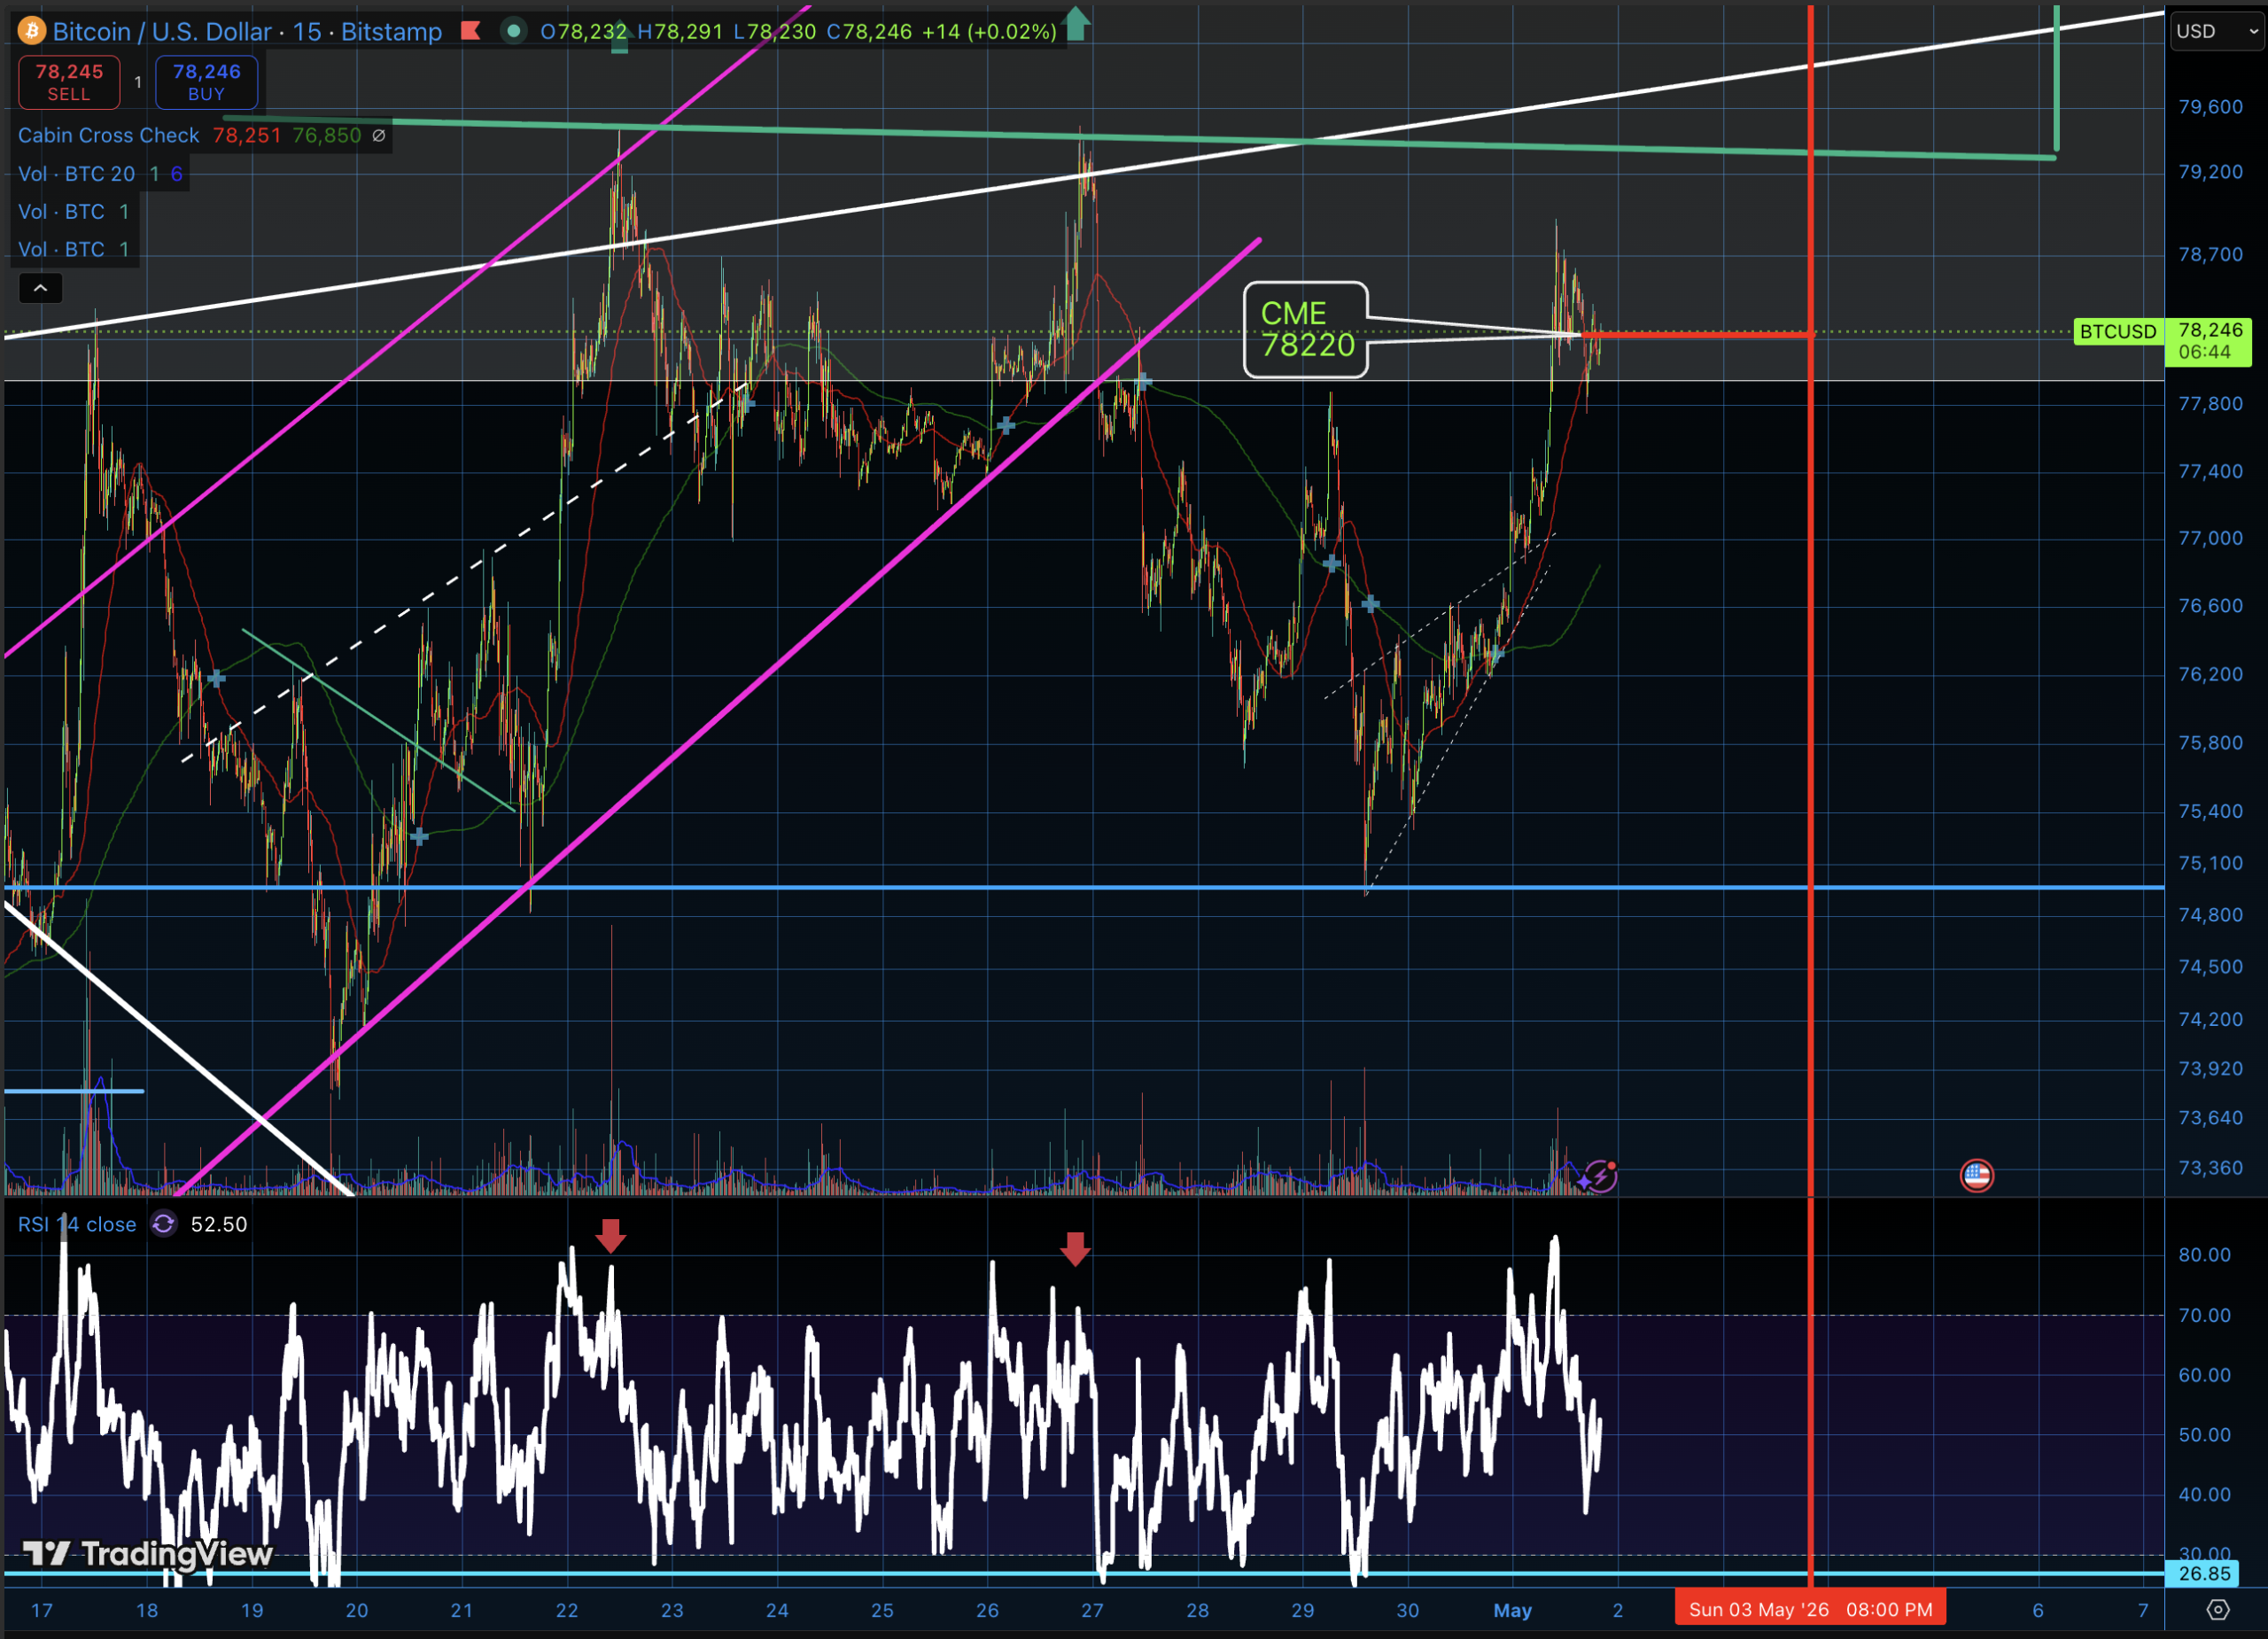
Bitcoin sits close to the top of the bull flag. Facing resistance from the white band and again, desperately trying to fight its way up to close the CME gap. It has been fighting for over a week to stay up here.
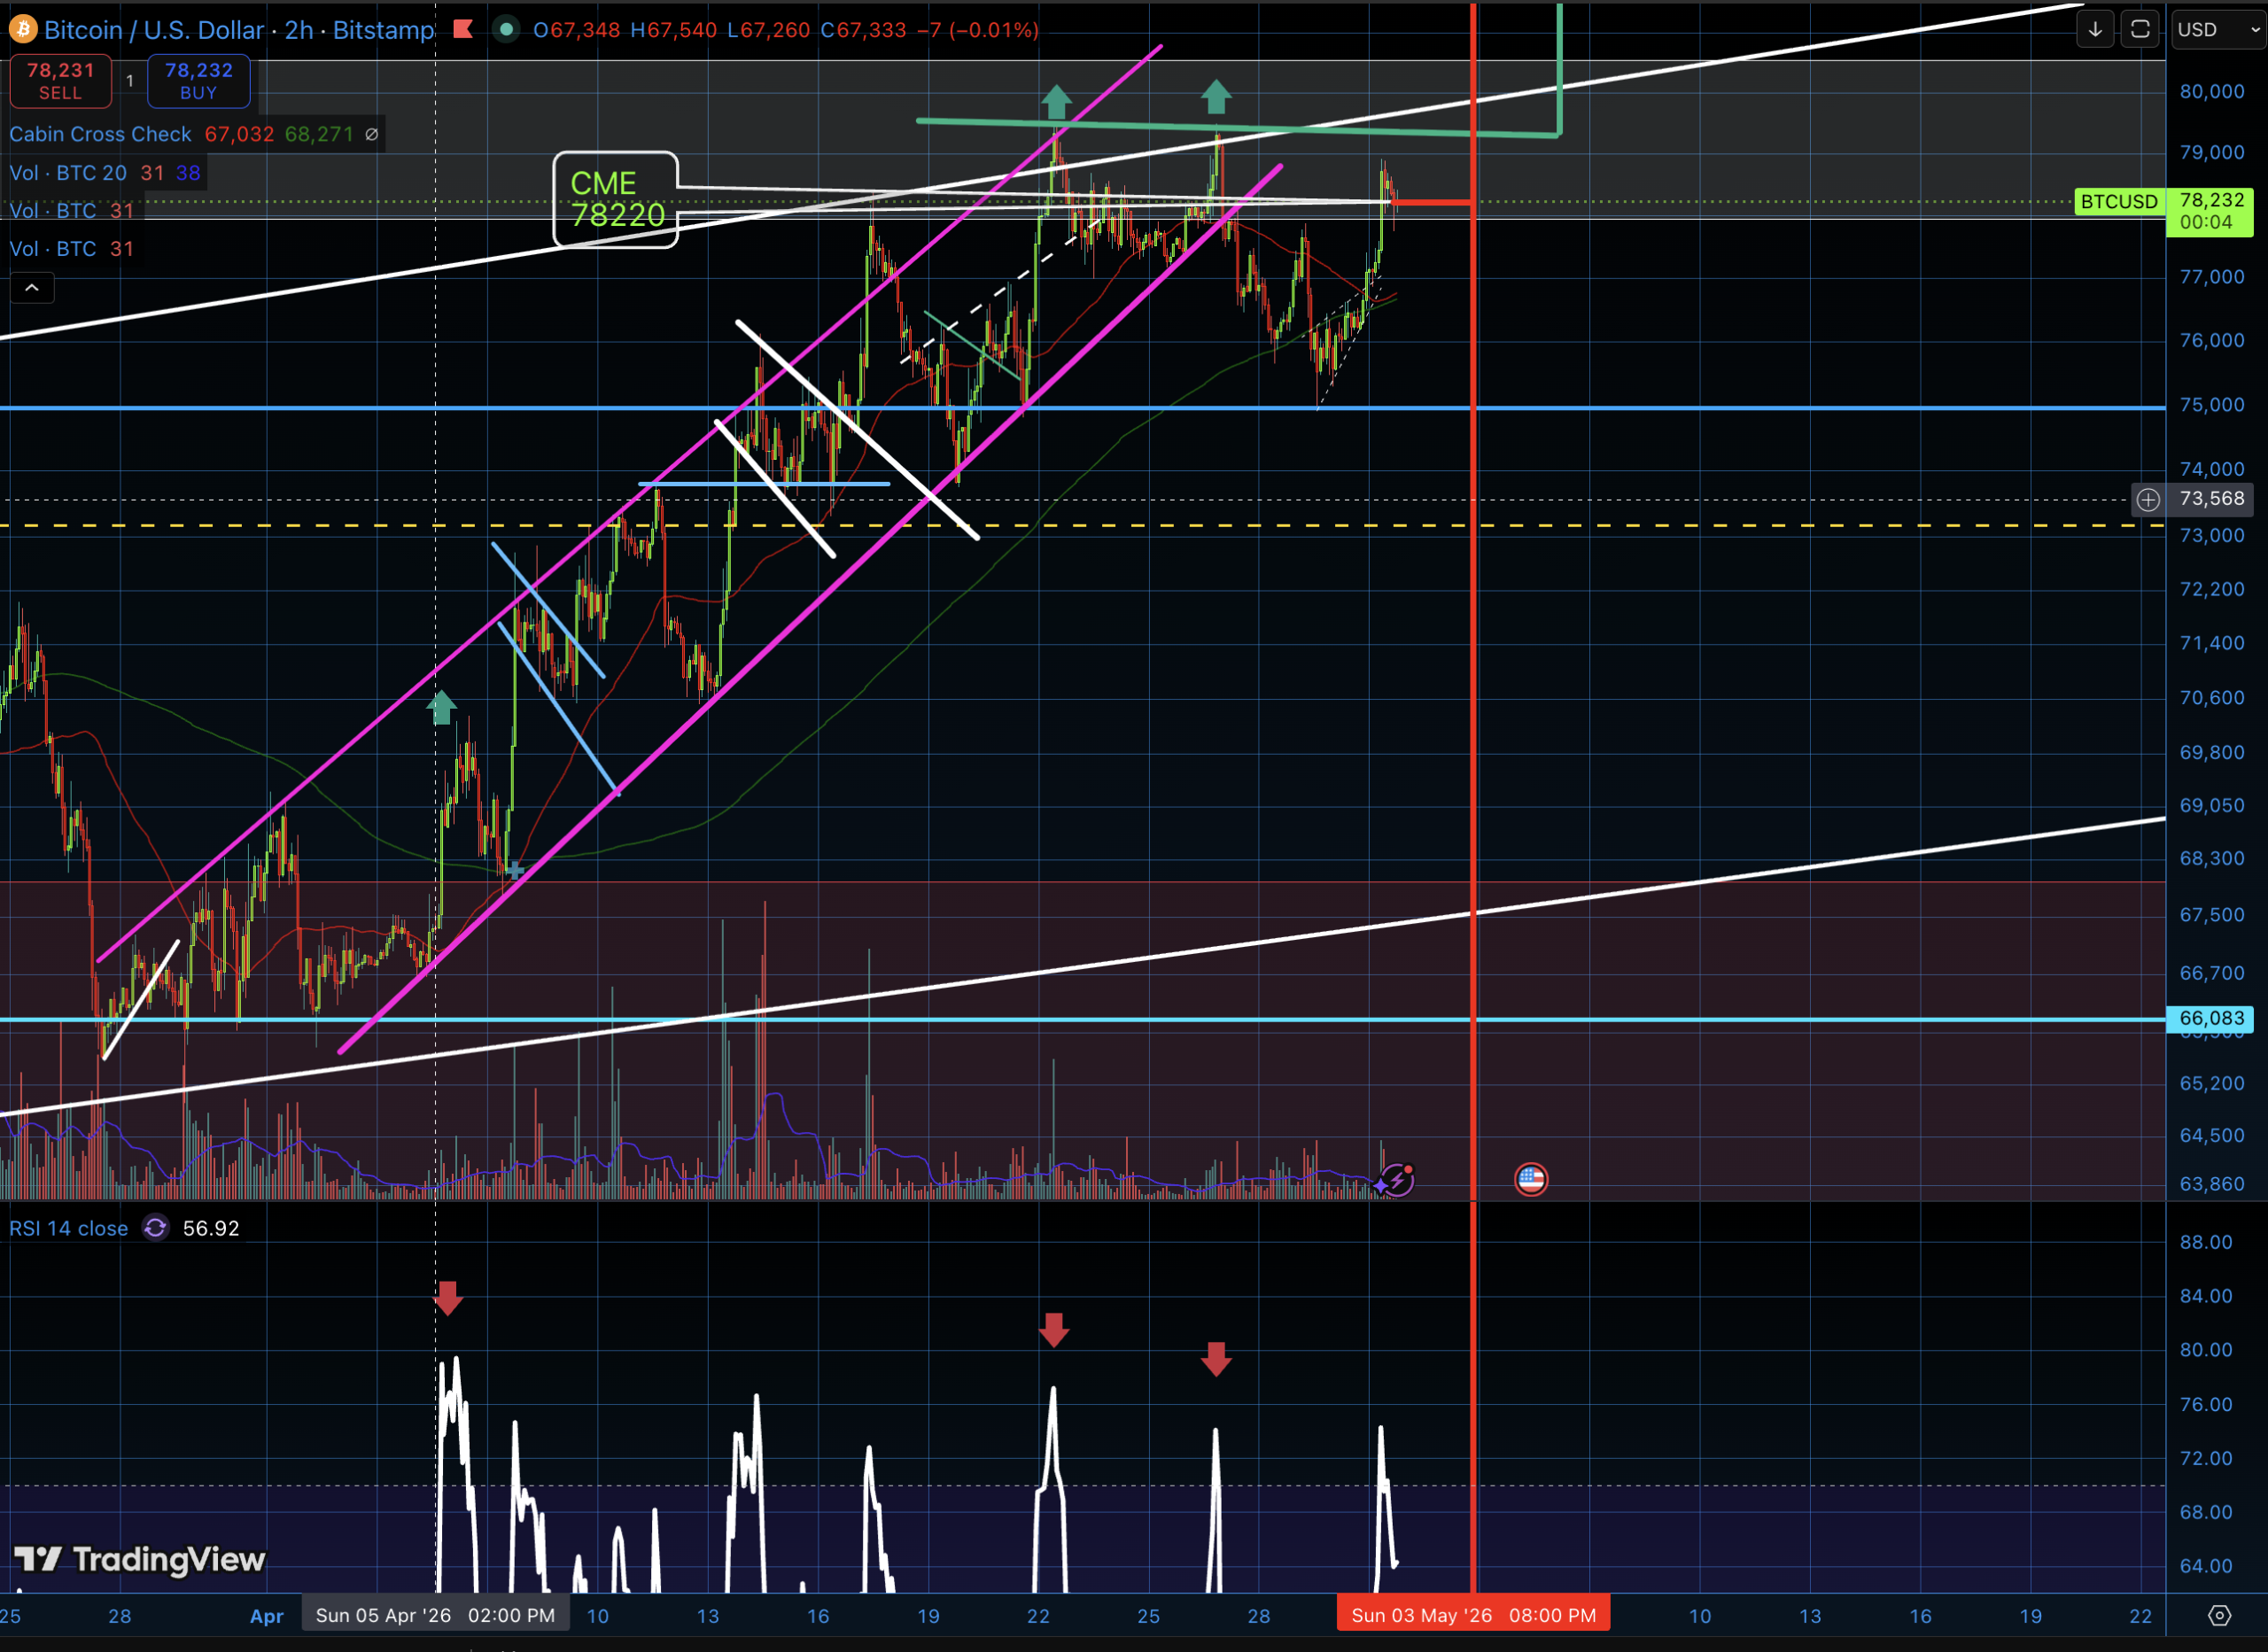
CME Closed for The Weekend
But at the same time there have been mixed signals with divergence on the RSI, as the price has been going up the entire month of April. The RSI has been declining, this is a sign that there is exhaustion whilst trying to stay up here and close that CME gap.
The BTC1! (CME Futures) chart has stopped for the weekend, so now wherever we go will leave a gap. If we go down, the chart will want to pull itself back up. If we go up the chart will want to come back down to close the gap.
The vertical red line in the chart above is Sunday night, the CME chart will start moving again, Sunday 5:00 PM Central Time (CT). The horizontal red line connecting to the vertical red line is the level the CME is at. We will see where it lands but we will have to watch over the weekend to see if any major moves happen that would create a gap. I suspect the chart will try to move sideways all weekend and then attempt a move early in the week. But at this time only time will tell.
Just keep in mind the 1st image on this post. We are ultimately in a bear flag. Unless it is invalidated with a breakout and a proper, sustainable retest of the breakout, this is still textbook and should be treated as such.
What It Might Be Doing
If you watch Bitcoin as much as I do and for as long as I have, you might have noticed that sometimes BTC seems like it has a mind of its own. Sometimes its as if it knows exactly what it is doing. It wants to close that gap, but there are also gaps to be closed near the bottom of the bear flag.
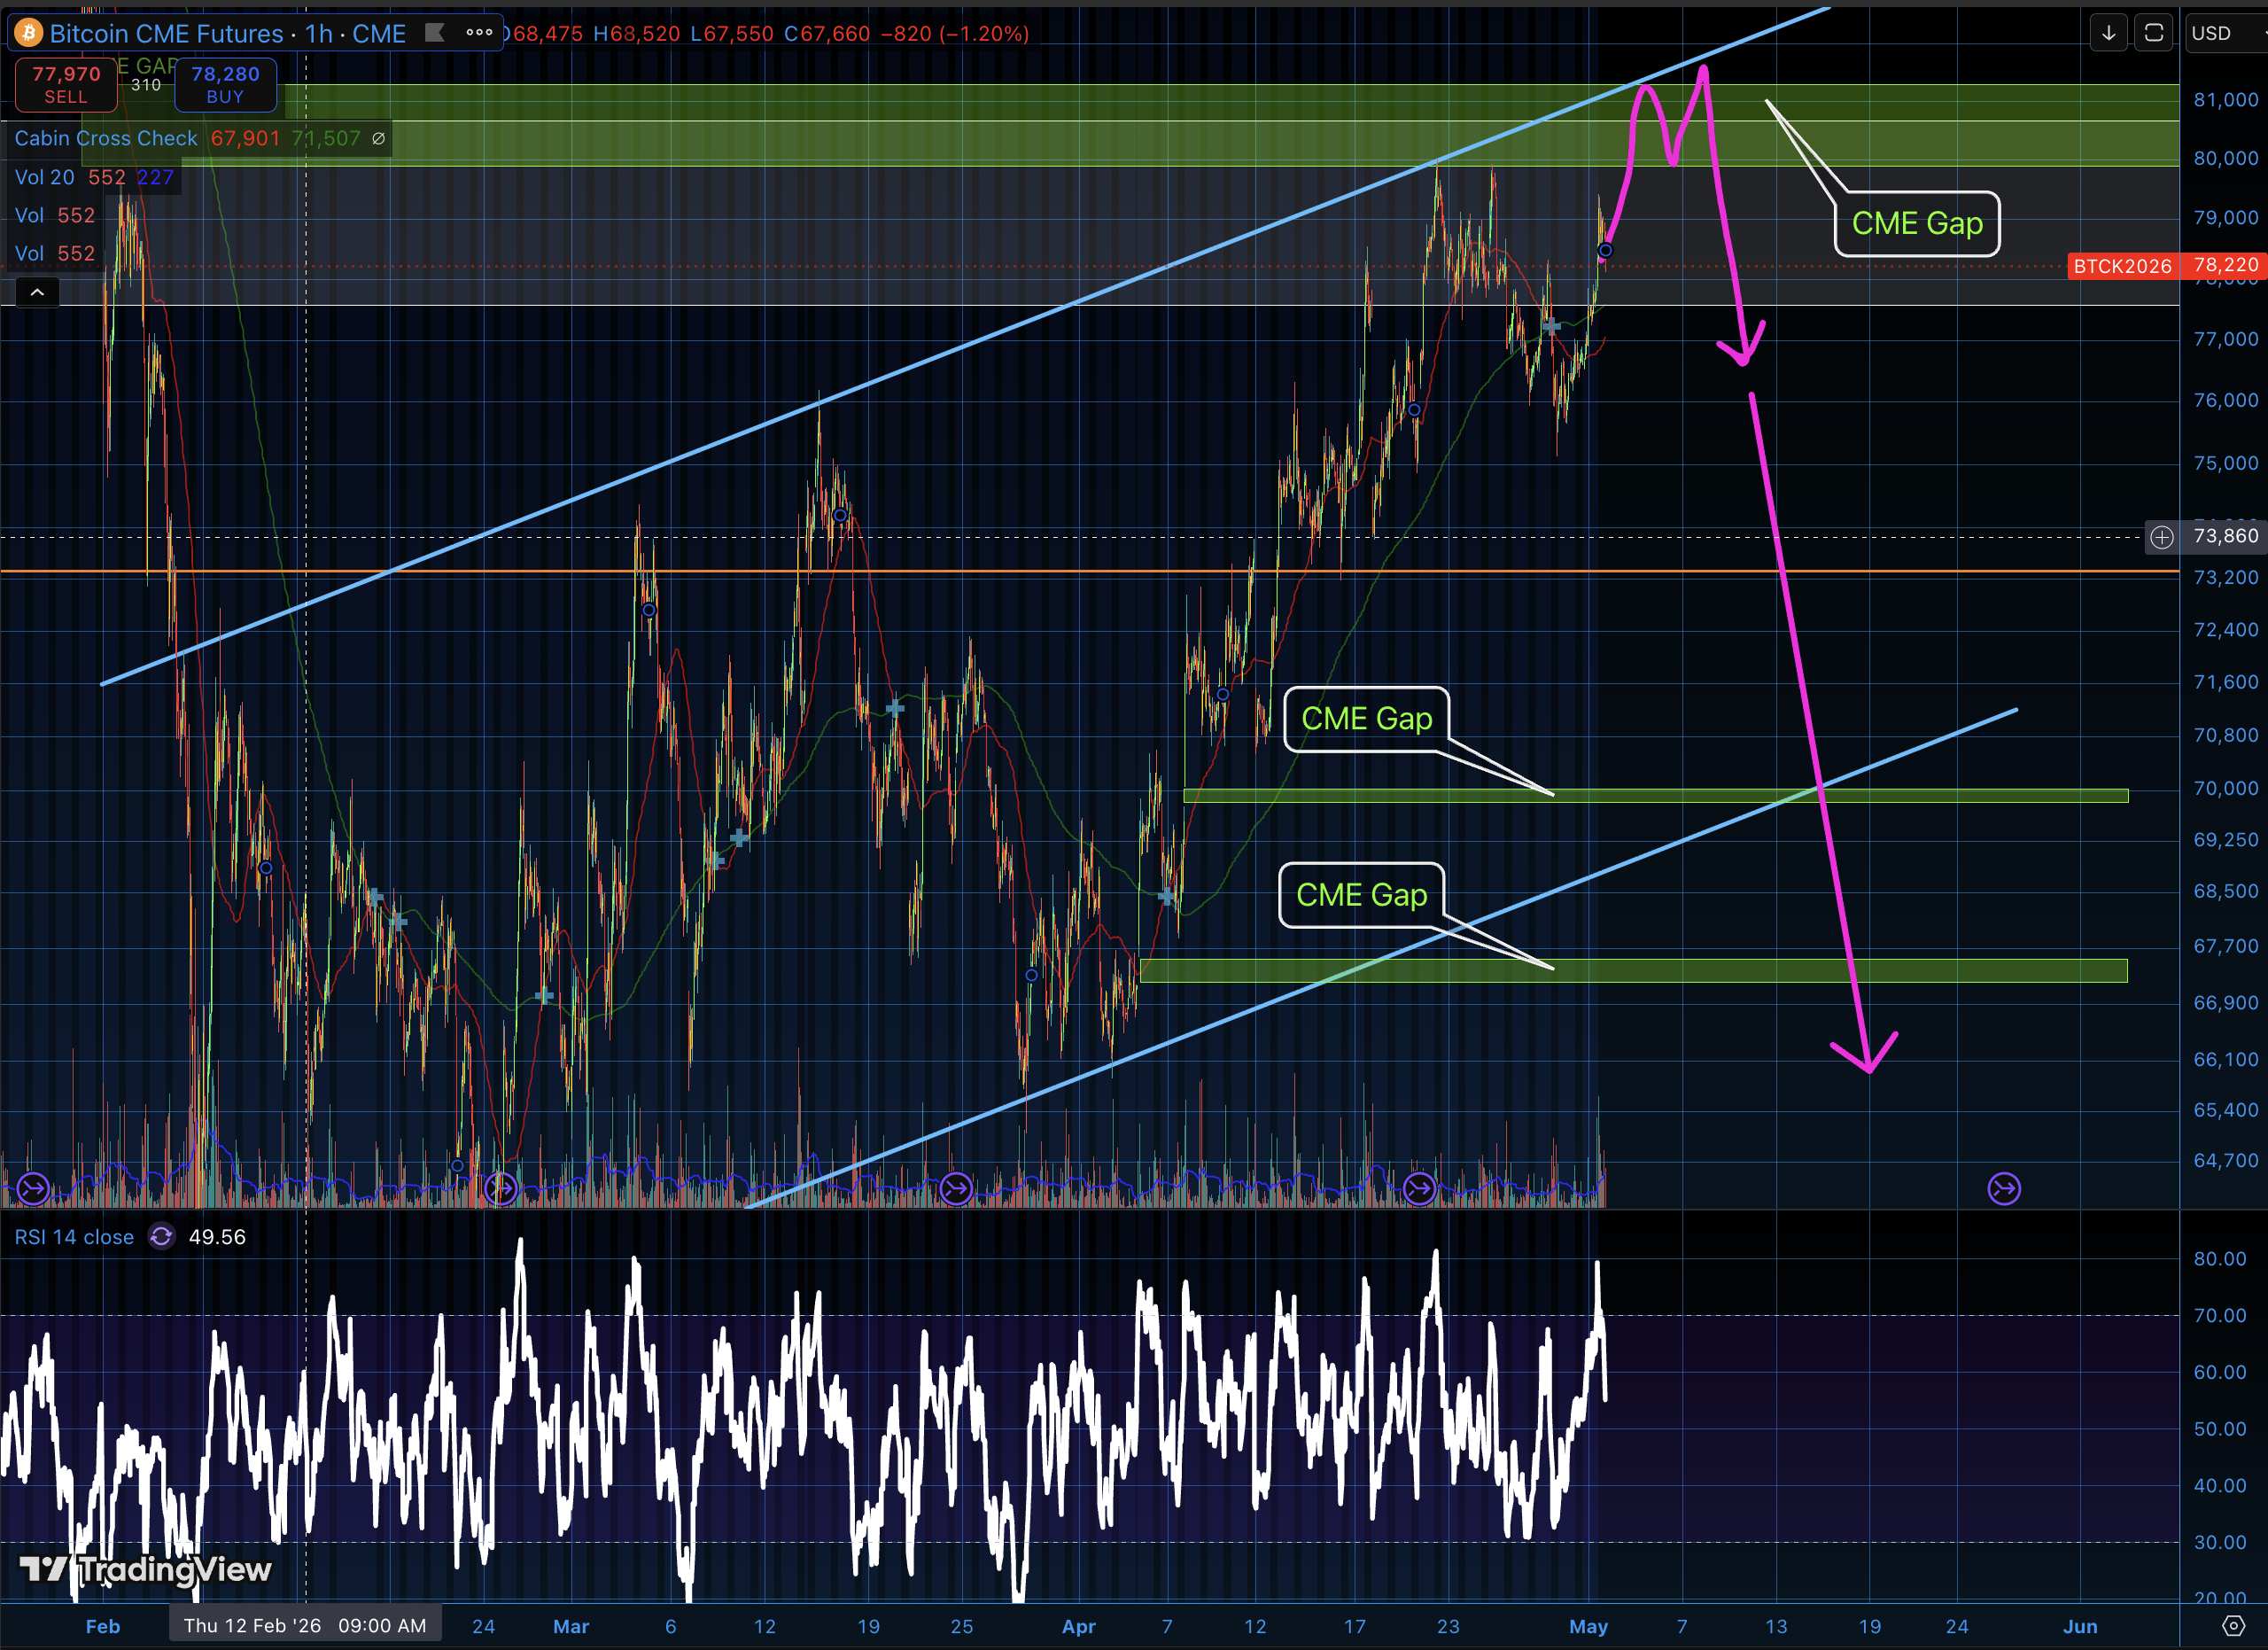
All of the green bars in this chart are CME gaps. Last weekend I was anticipating a possible fakeout to the top side to close the gap. But perhaps, what Bitcoin wants to do is ride the top of the bear flag formation up until roughly the 8th of May where it can cleanly close the gap without breaking market structure. Then head down to close the gaps below and finally play out the structure of the chart as per the textbook. At the same time trapping overzealous longs at the top.
If this is the case, we will have a long week ahead of bulls calling for moon, possible fakeouts and lots of chop as the chart rides the top and tries to fight its way around in the white resistance band.
Some might call this a no trade zone and I would partly agree. At this point all you can do is keep to any thesis regardless of bearish or bullish and keep a tight stop loss. For me, I would treat this as what it is until proven 100% otherwise.
- It is a bear flag
- It will likely play psychological games which means fakeouts
- It has to prove any break out to the upside substantially for it to be credible
- Which means tests and re tests
- If not, it is still a bear flag
Sell In May & Go Away
Until it is proven otherwise I lean bearish and this would make sense with the “sell in may and go away” sentiment.

With all the presented charts, would it be hard to picture the outcome: BTC Price rides up the top of the bear flag formation, making everyone believe it will be bullish, even throw false breakouts/fakeouts. Close the CME gap only to plummet down? And then everyone will be saying “Sell in may and go away” after they were looking to see BTC breakout bullish and moon.
With all that we have seen of BTC in the past, I wouldn’t doubt it.
Categorised in: Cryptocurrency Markets, Cryptocurrency Trading, Technical Analysis
This post was written by BlockAdvisor