Bitcoin, Is The Bottom In?
April 15, 2026 2:19 am Leave your thoughtsIn my last post here: https://blockadvisor.io/2026/02/24/the-crypto-sell-off-of-2025-2026/ I discussed the sell off we have been in since Oct 2025. It has been about 6 months since and I have been riding the wave down with a 25X short ever since.
Now the question is: Where is the bottom. Many people on X are claiming that the bottom is in now. But if that was the case, why are we in a bear flag? To find the bottom, we have to pay more attention and look for confluence. At the same time, we have to examine the fundamentals/geo political situation.
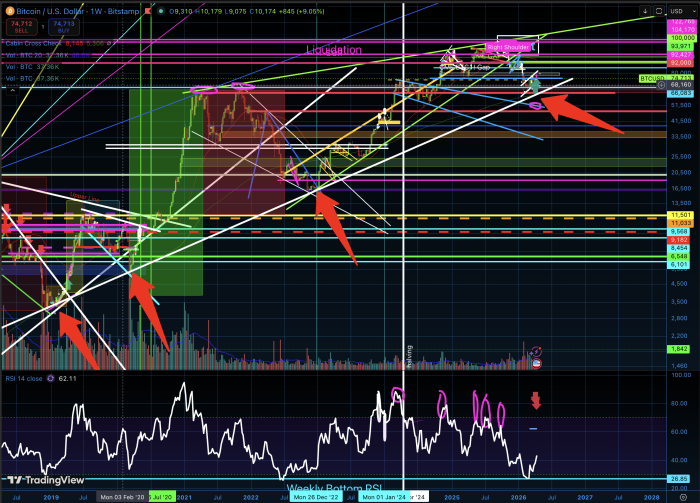
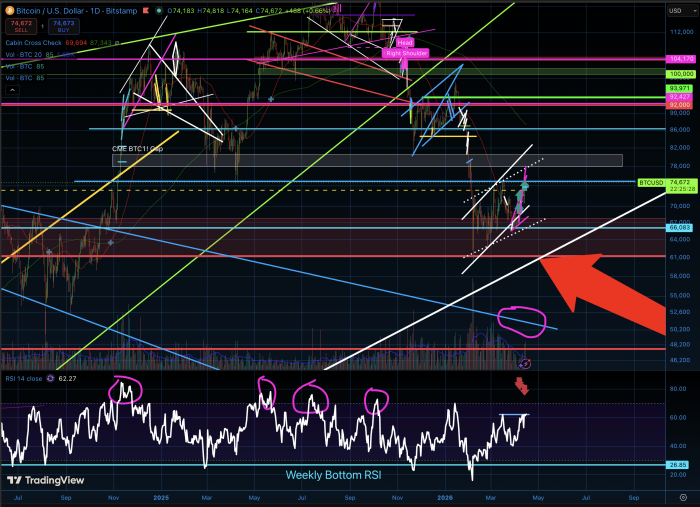
First let’s look at the chart on the macro. On the monthly we can observe the long term structure. Forgive me for the busy chart. There is a lot of data in here. Let’s focus on the white lines, particularly one with the 4 red arrows pointing to it. This support goes back to 2017 and has been a reliable marker of the lows which has not been penetrated since it was formed at the inflection point where the 1st red arrow is where the white line converges with the 2 white lower support lines.
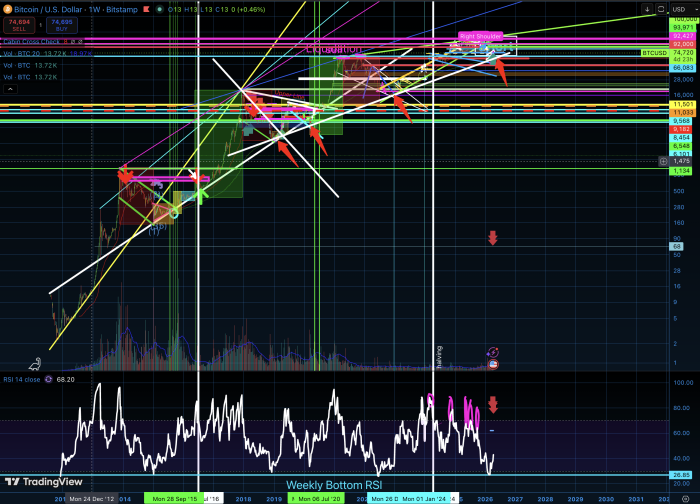
If we look closer, we can see that support line, it has 3 touches on it confirming it. This should be STRONG support. The RSI being reset near it on the weekly is proof of its existence and support.
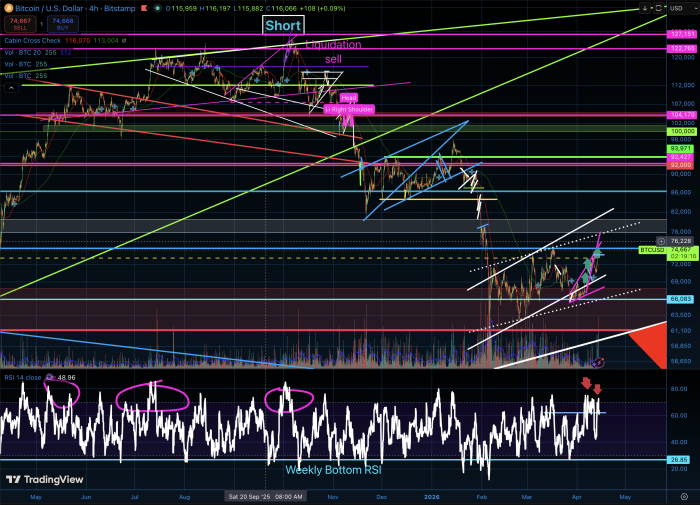
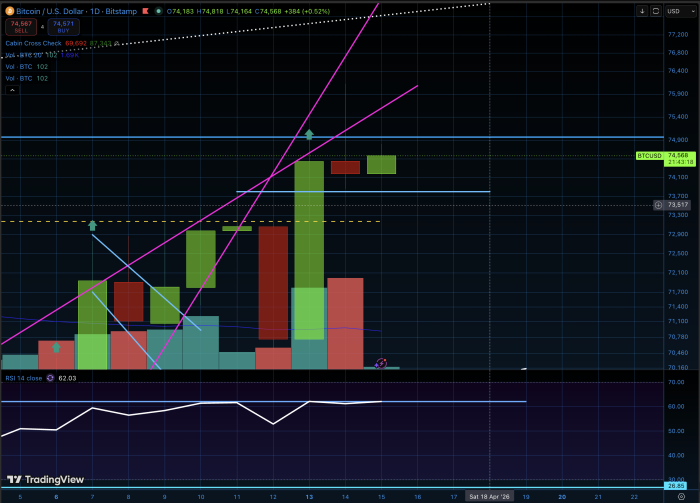
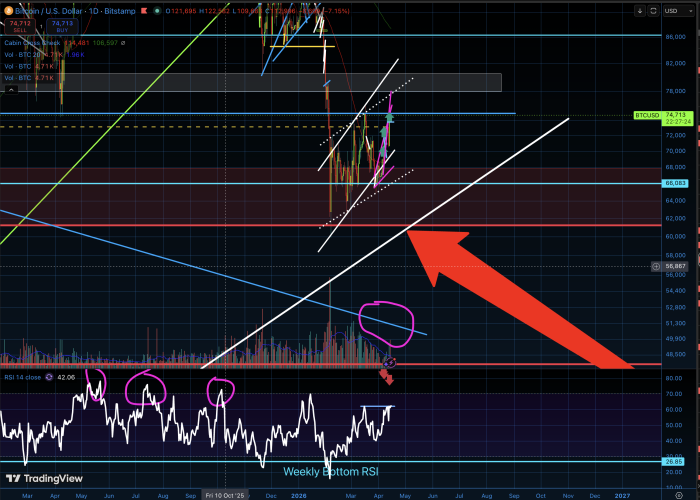
Does this mean the pain is over? So far, Im still not convinced the pain is 100% over. Why? Let’s zoom in more. The current situation on the smaller time frames. 1H, 2H, 3H and 4H all show divergence on the RSI. The price action faked out above resistance but fell back in. The RSI keeps printing lower as shown with the red arrows on the RSI diverging from the green up arrows showing the price action going higher.
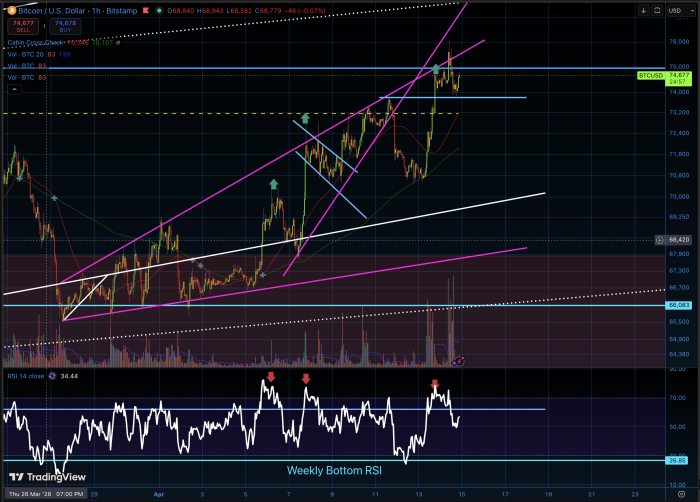
Also, as I stated earlier, we are in a mid term bear flag. With the added divergence on the RSI and the confluence of the lower white support line from 2017, we technically should come down to it. Will we go through? If we do, IMHO it will only be a wick on the longer time frame charts. Possibly we wick down to the pink circle to retest the previous formation (this has been my thesis so far for months now).
Also note that the last daily candle that closed as of 14 April 2026 is a shooting star doji. More fuel for the bearish fire.
TLDR: Quick trip down for the last leg and back up.
What could be the trigger? This last few days of upside action was a result of trump claiming they had a ceasefire. When I heard that I immediately knew it was a load of crap. Iran made it’s demands and the USA has stated they will under no circumstances allow certain things that Iran was demanding. To believe they came to an agreement is foolish. Trump has been making false claims about this war since it has started. They are at an impasse. Full stop.

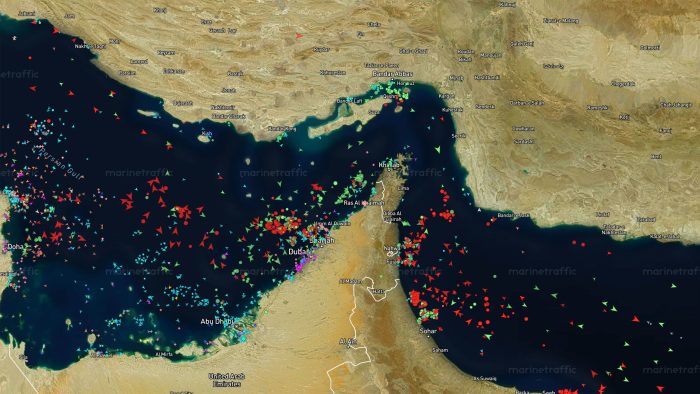
Trump also said: “Effective immediately, the United States Navy, the Finest in the World, will begin the process of BLOCKADING any and all Ships trying to enter, or leave, the Strait of Hormuz”
However, after this statement a ship from China (leaving from the UAE) passed through. Now people are arguing that they are letting ships through so long as they are not leaving from Iran ports. But that is NOT what Trump stated would be the case. He said the blockade of the blockade was going to be nothing gets through. Again he is talking pure hot air. The Chinese ship going through is a sign of strength on the side of B.R.I.C.S. and a sign of weakness for the USA and Israel.
ultimately the Strait of Hormuz is closed and Iran has control, this rally was premature and a result of Trump, once again manipulating the market. The shooting will likely start up again and Trump will most likely not want to take the L. As I stated in many past posts, none of these people want to take the L and they will double down as they get more and more desperate.
So things will get worse and when they do. The market will correct as such and I think the divergence in the 1 to 4H charts is showing this. Within the next week or so we should see movement.
IF I am wrong and the price moves up. We needs to clear roughly 82K and confirm over the bear flag to be out of the woods.
Tags: bear market, Bitcoin, bull market 2026, relief rally, Strait of hormuz, ww3Categorised in: Cryptocurrency Markets, Cryptocurrency Trading, Fundamental Analysis, Technical Analysis
This post was written by BlockAdvisor