We Are Not In A Bear Market… Yet
January 11, 2022 1:12 am Leave your thoughts[responsivevoice_button voice="UK English Male" buttontext="Listen to Post on/off"]

For months I have been telling all of my crypto friends and people in my Telegram chat: https://t.me/blockadvisorIO that I was anticipating a EOY dip. Why? Because everyone and their momma who happens to be in this market has been acting like it and saying it. As if the end of the year, BTC and crypto will magically go into a bear market reminiscent of 2018. There is always a possibility but personally I don’t buy it. This leads me to believe it will be yet another fake out. Most people are looking at the charts but not looking deep enough and because everyone was saying it, it becomes a self fulfilling washout prophecy of the weak and fearful. Let’s take a look at some charts:
BTCUSD/M1
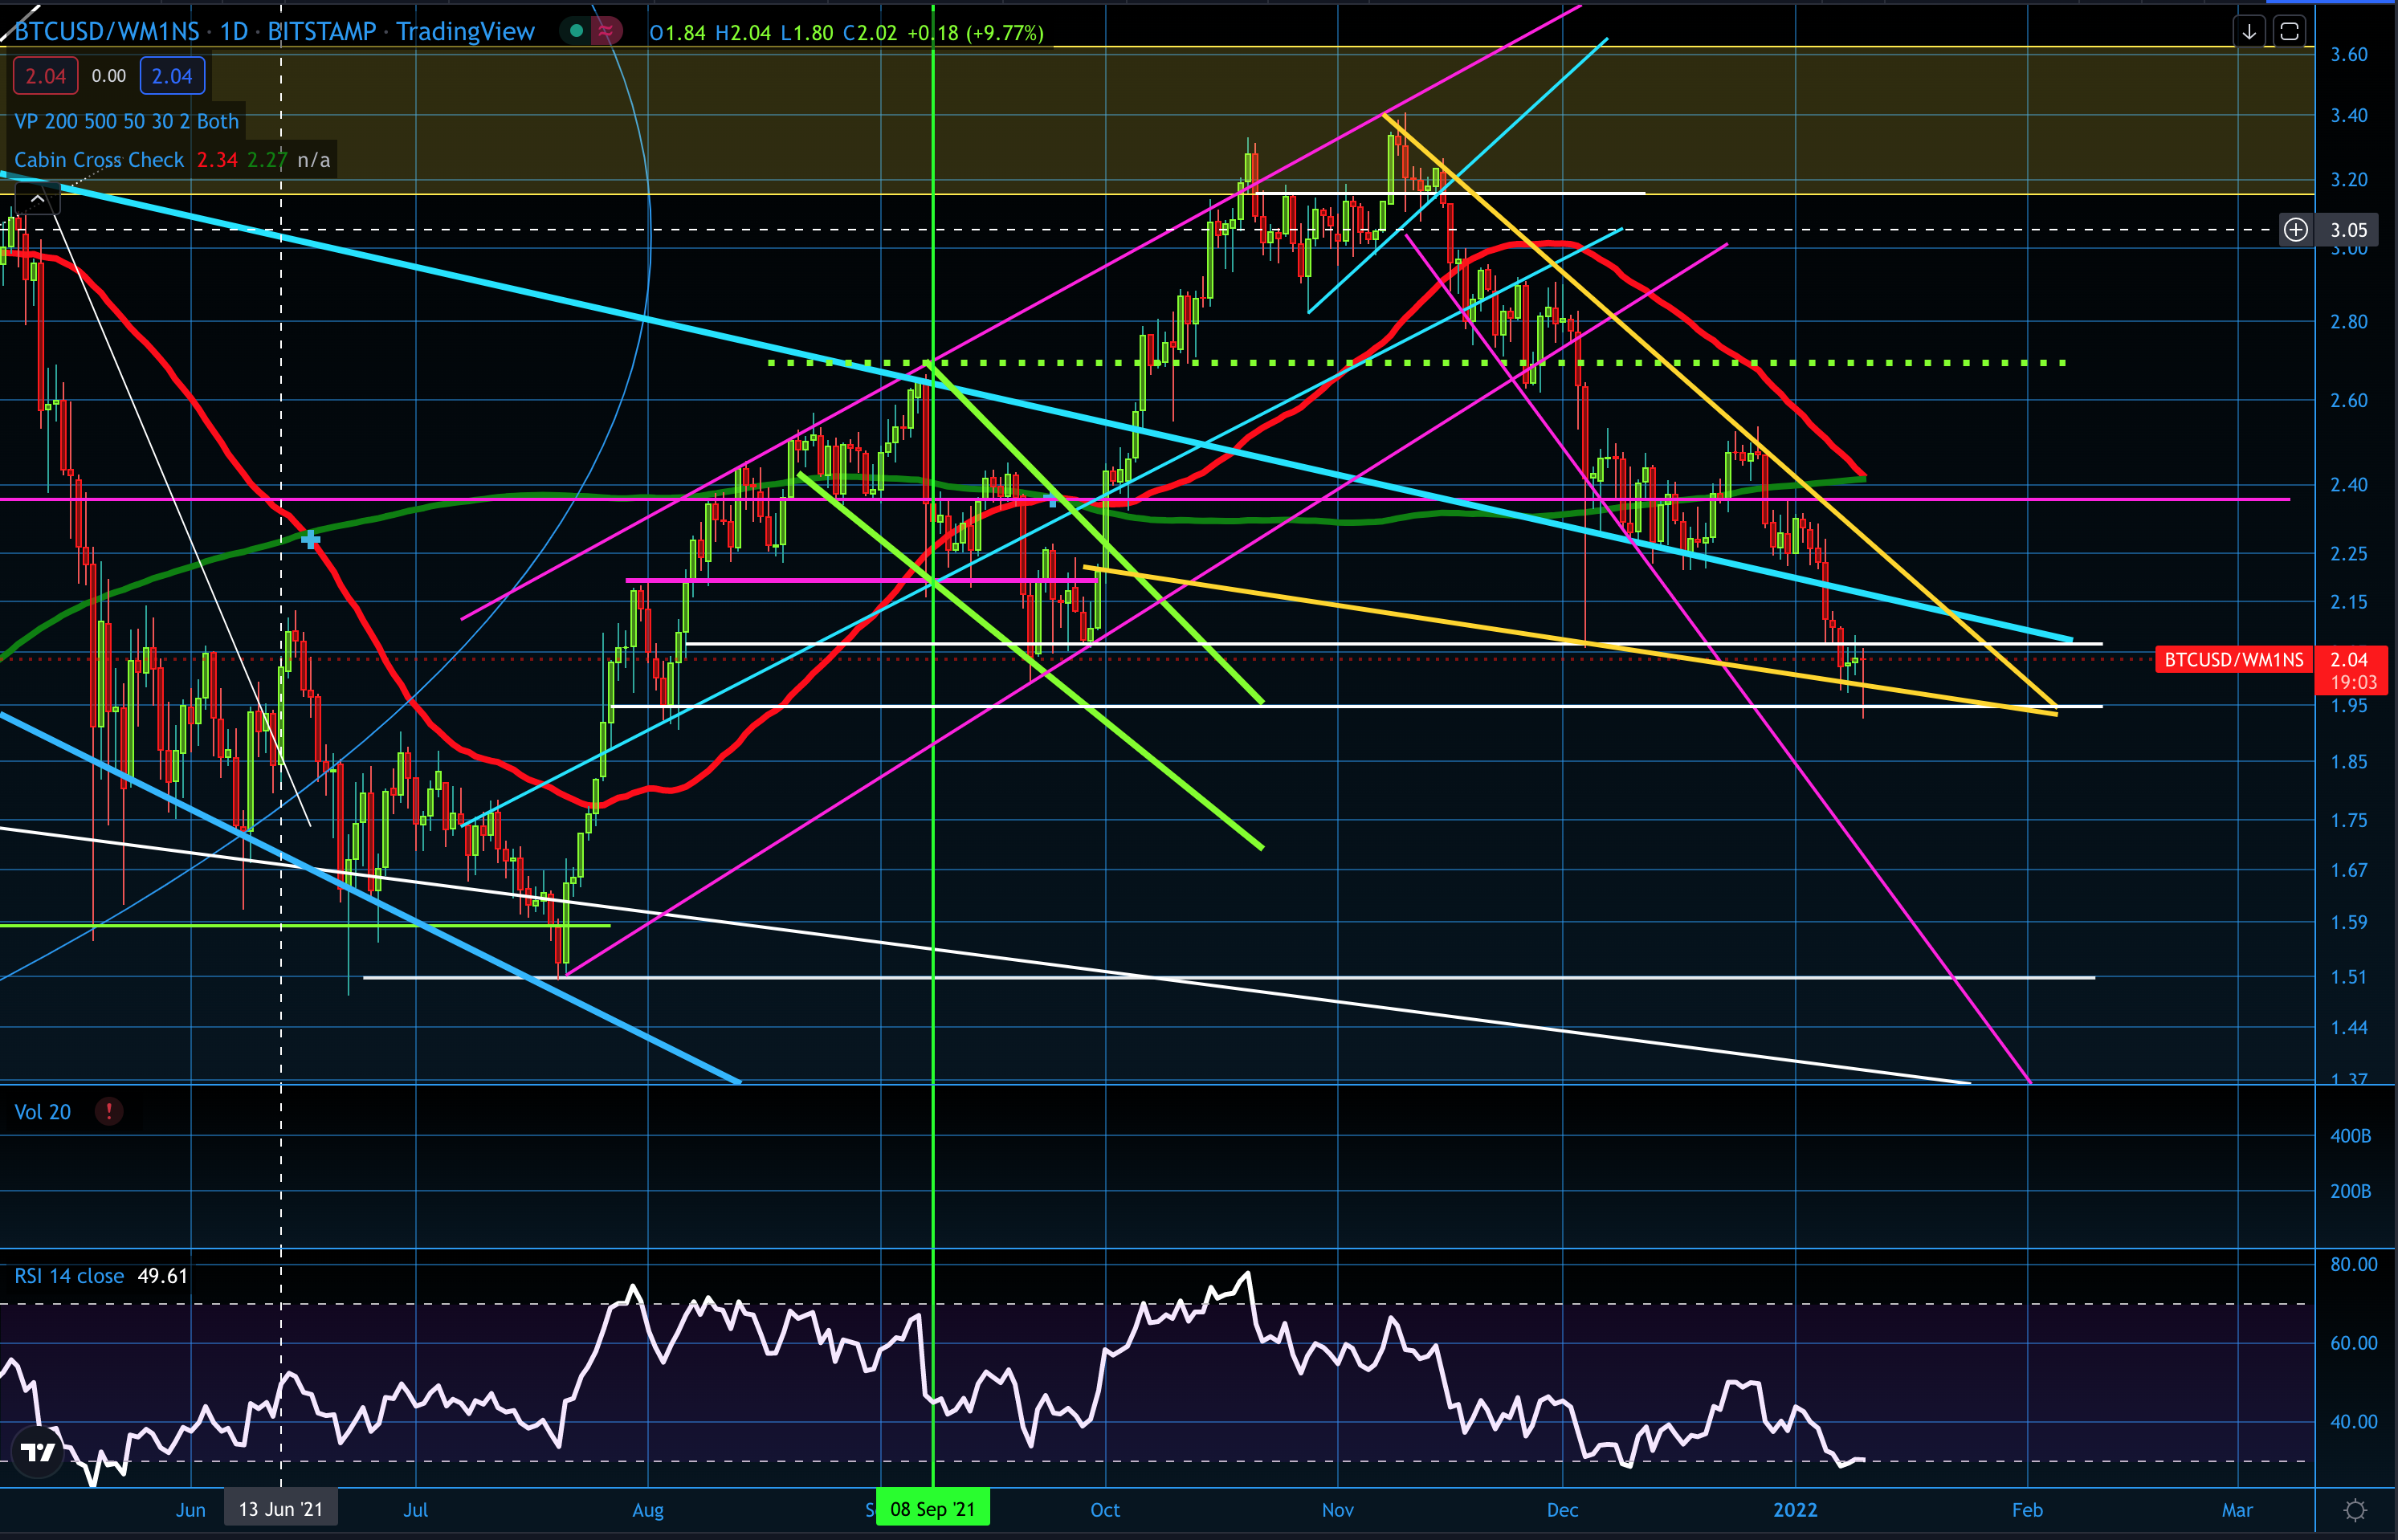
Many people see this and think it’s a head and shoulders, it is not. The right shoulder is a wick. For it to be a true head and shoulders the candle body should have closed on the white line of support. Thus it becomes an irregular head and shoulders and these on many occasions fake traders out.
What we really have here is a descending wedge so far in the yellow lines. This is a bullish sign and a sign of a fake out.
Also note the top yellow line and the purple bottom line. This is an ascending broadening wedge and they usually break bullish. So we have 2 patterns printed over each other, both bullish.
Also, on a more macro scale, the cyan color lines is an ascending broadening wedge. These are for the most part bullish patterns. it could be the case that it falling back into the formation is part of the fake out. If it breaks back out it may end up looking like a wick down on larger time frames.
As of writing it is fighting under the the white resistance line trying to climb back up.
*Side Note* See the yellow bar at the top? That bar is the level of resistance we must pass by to see a true ALT season. See my post on it here.
TOTAL
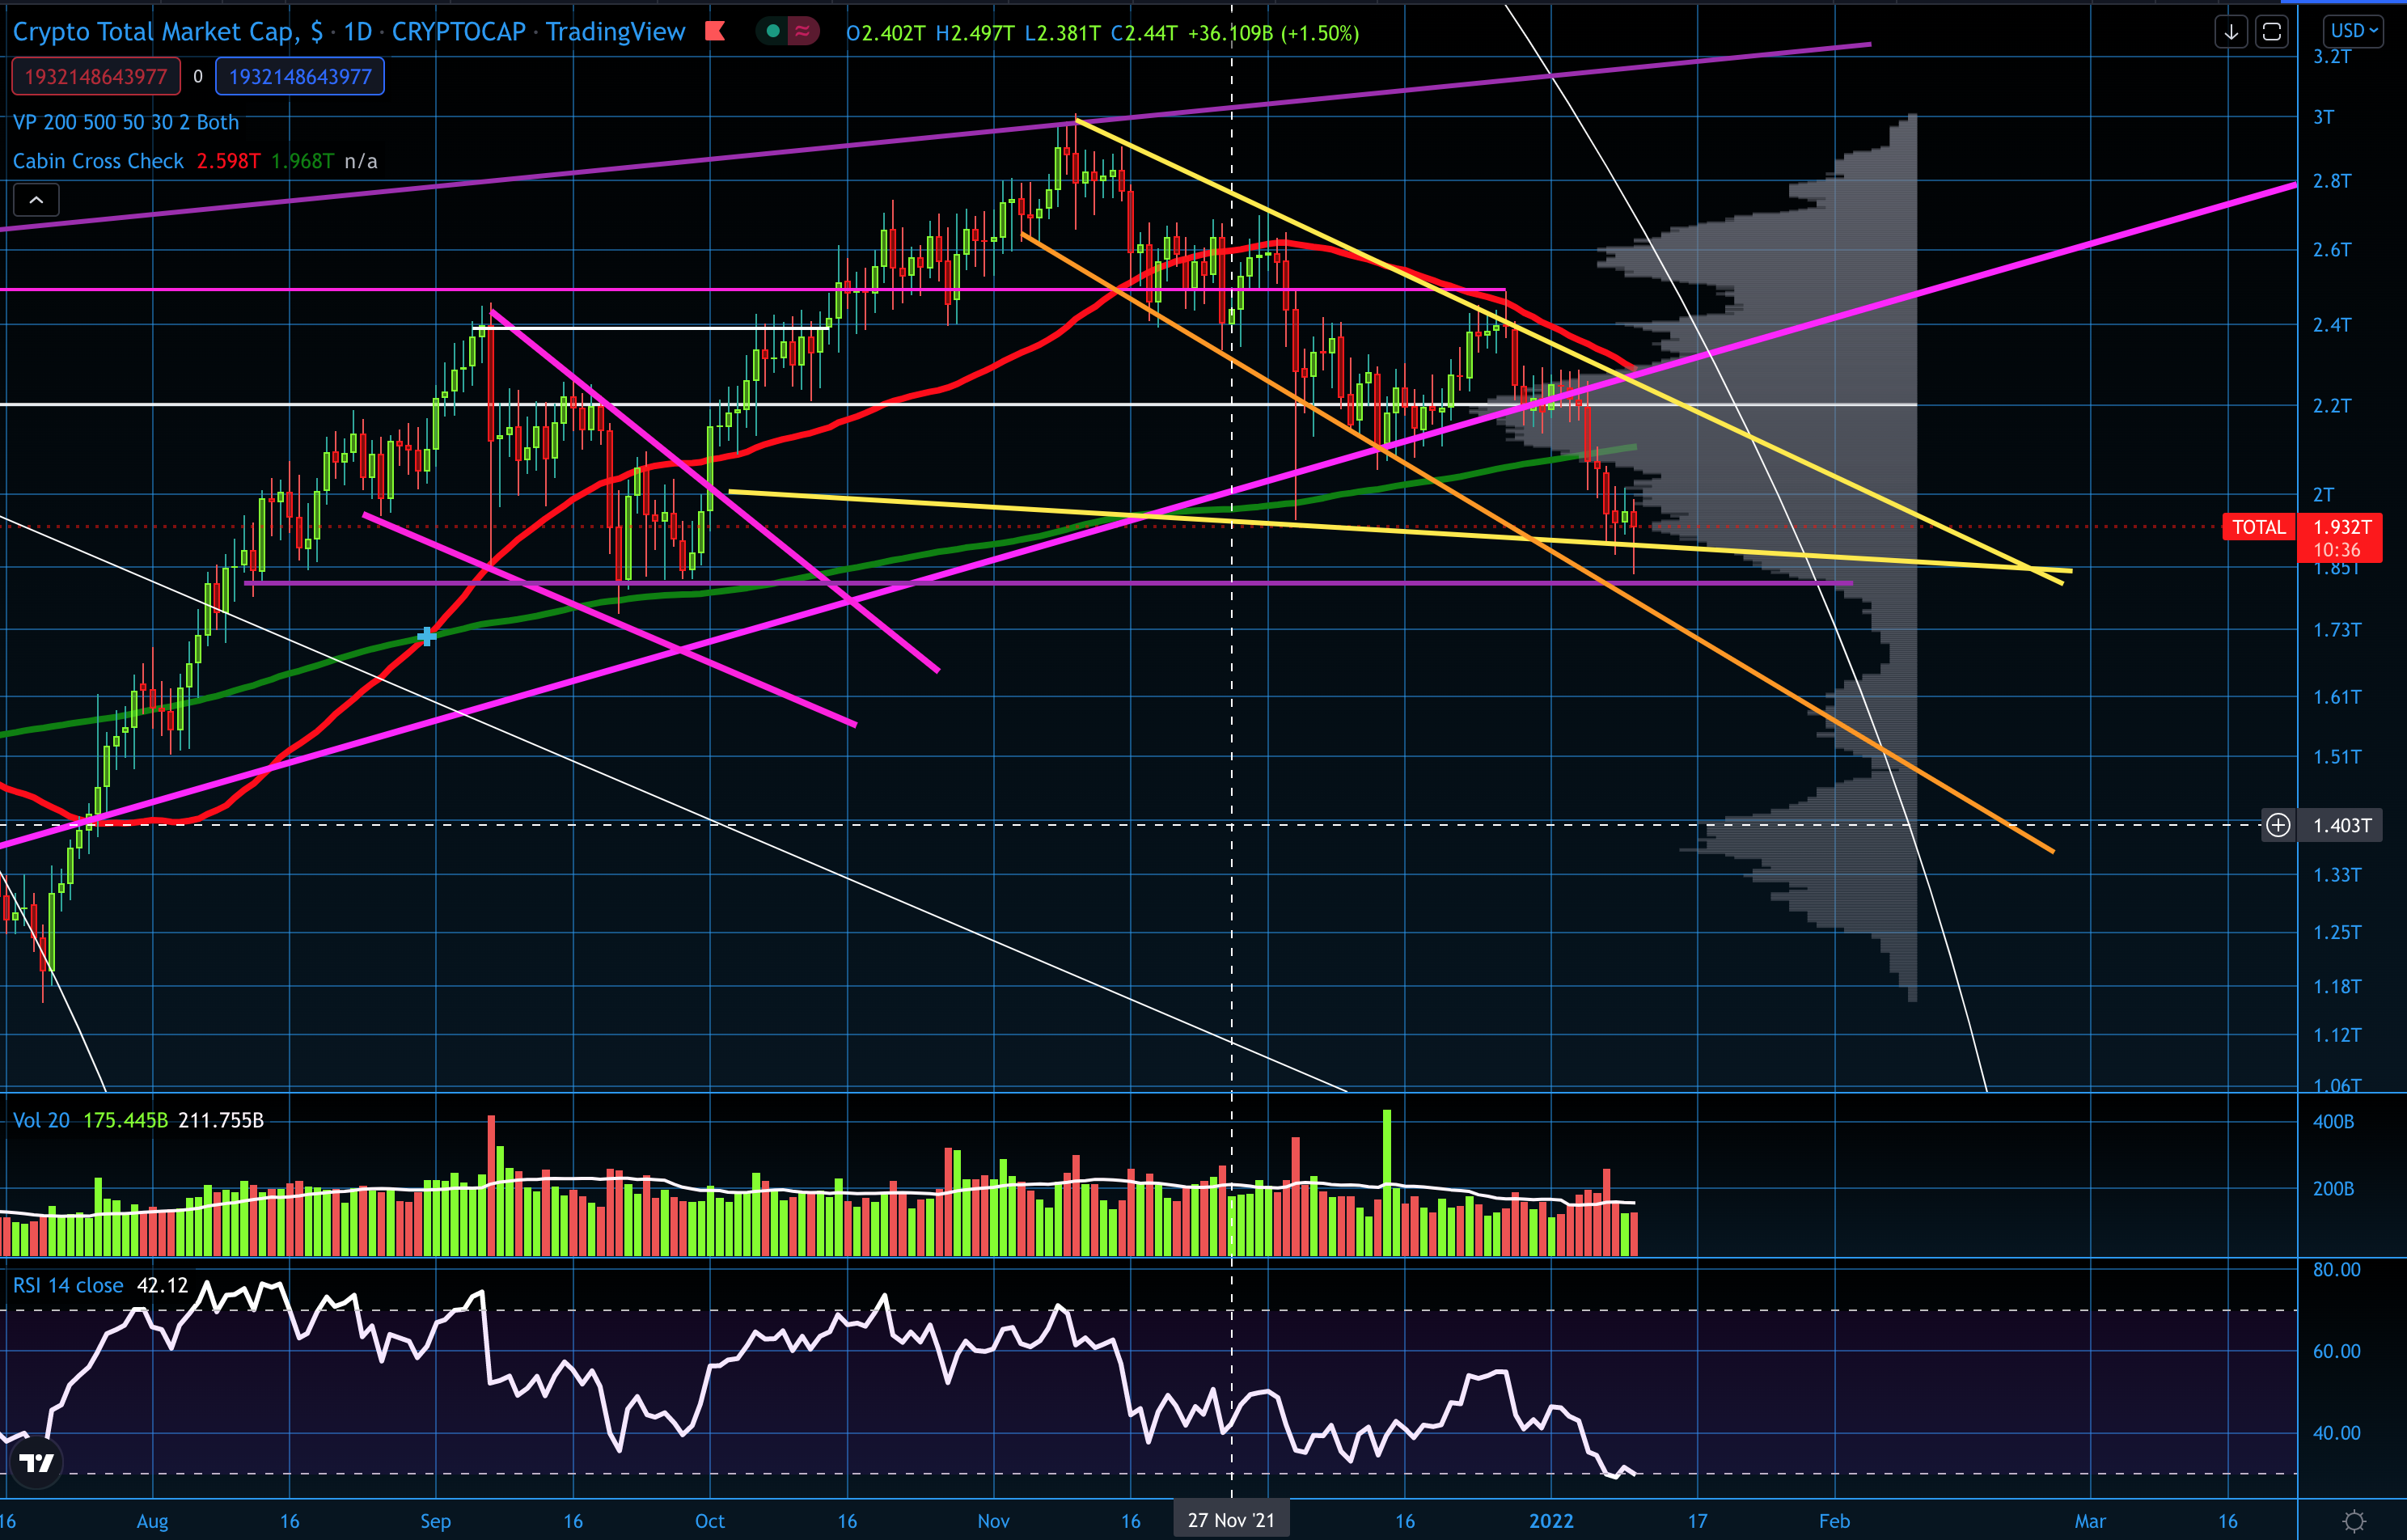
Again, here we have a descending broadening wedge with the top yellow line and the bottom orange line. There is also the same descending wedge albeit it is a tentative one in this case. It is not a head and shoulder pattern however.
TOTAL2
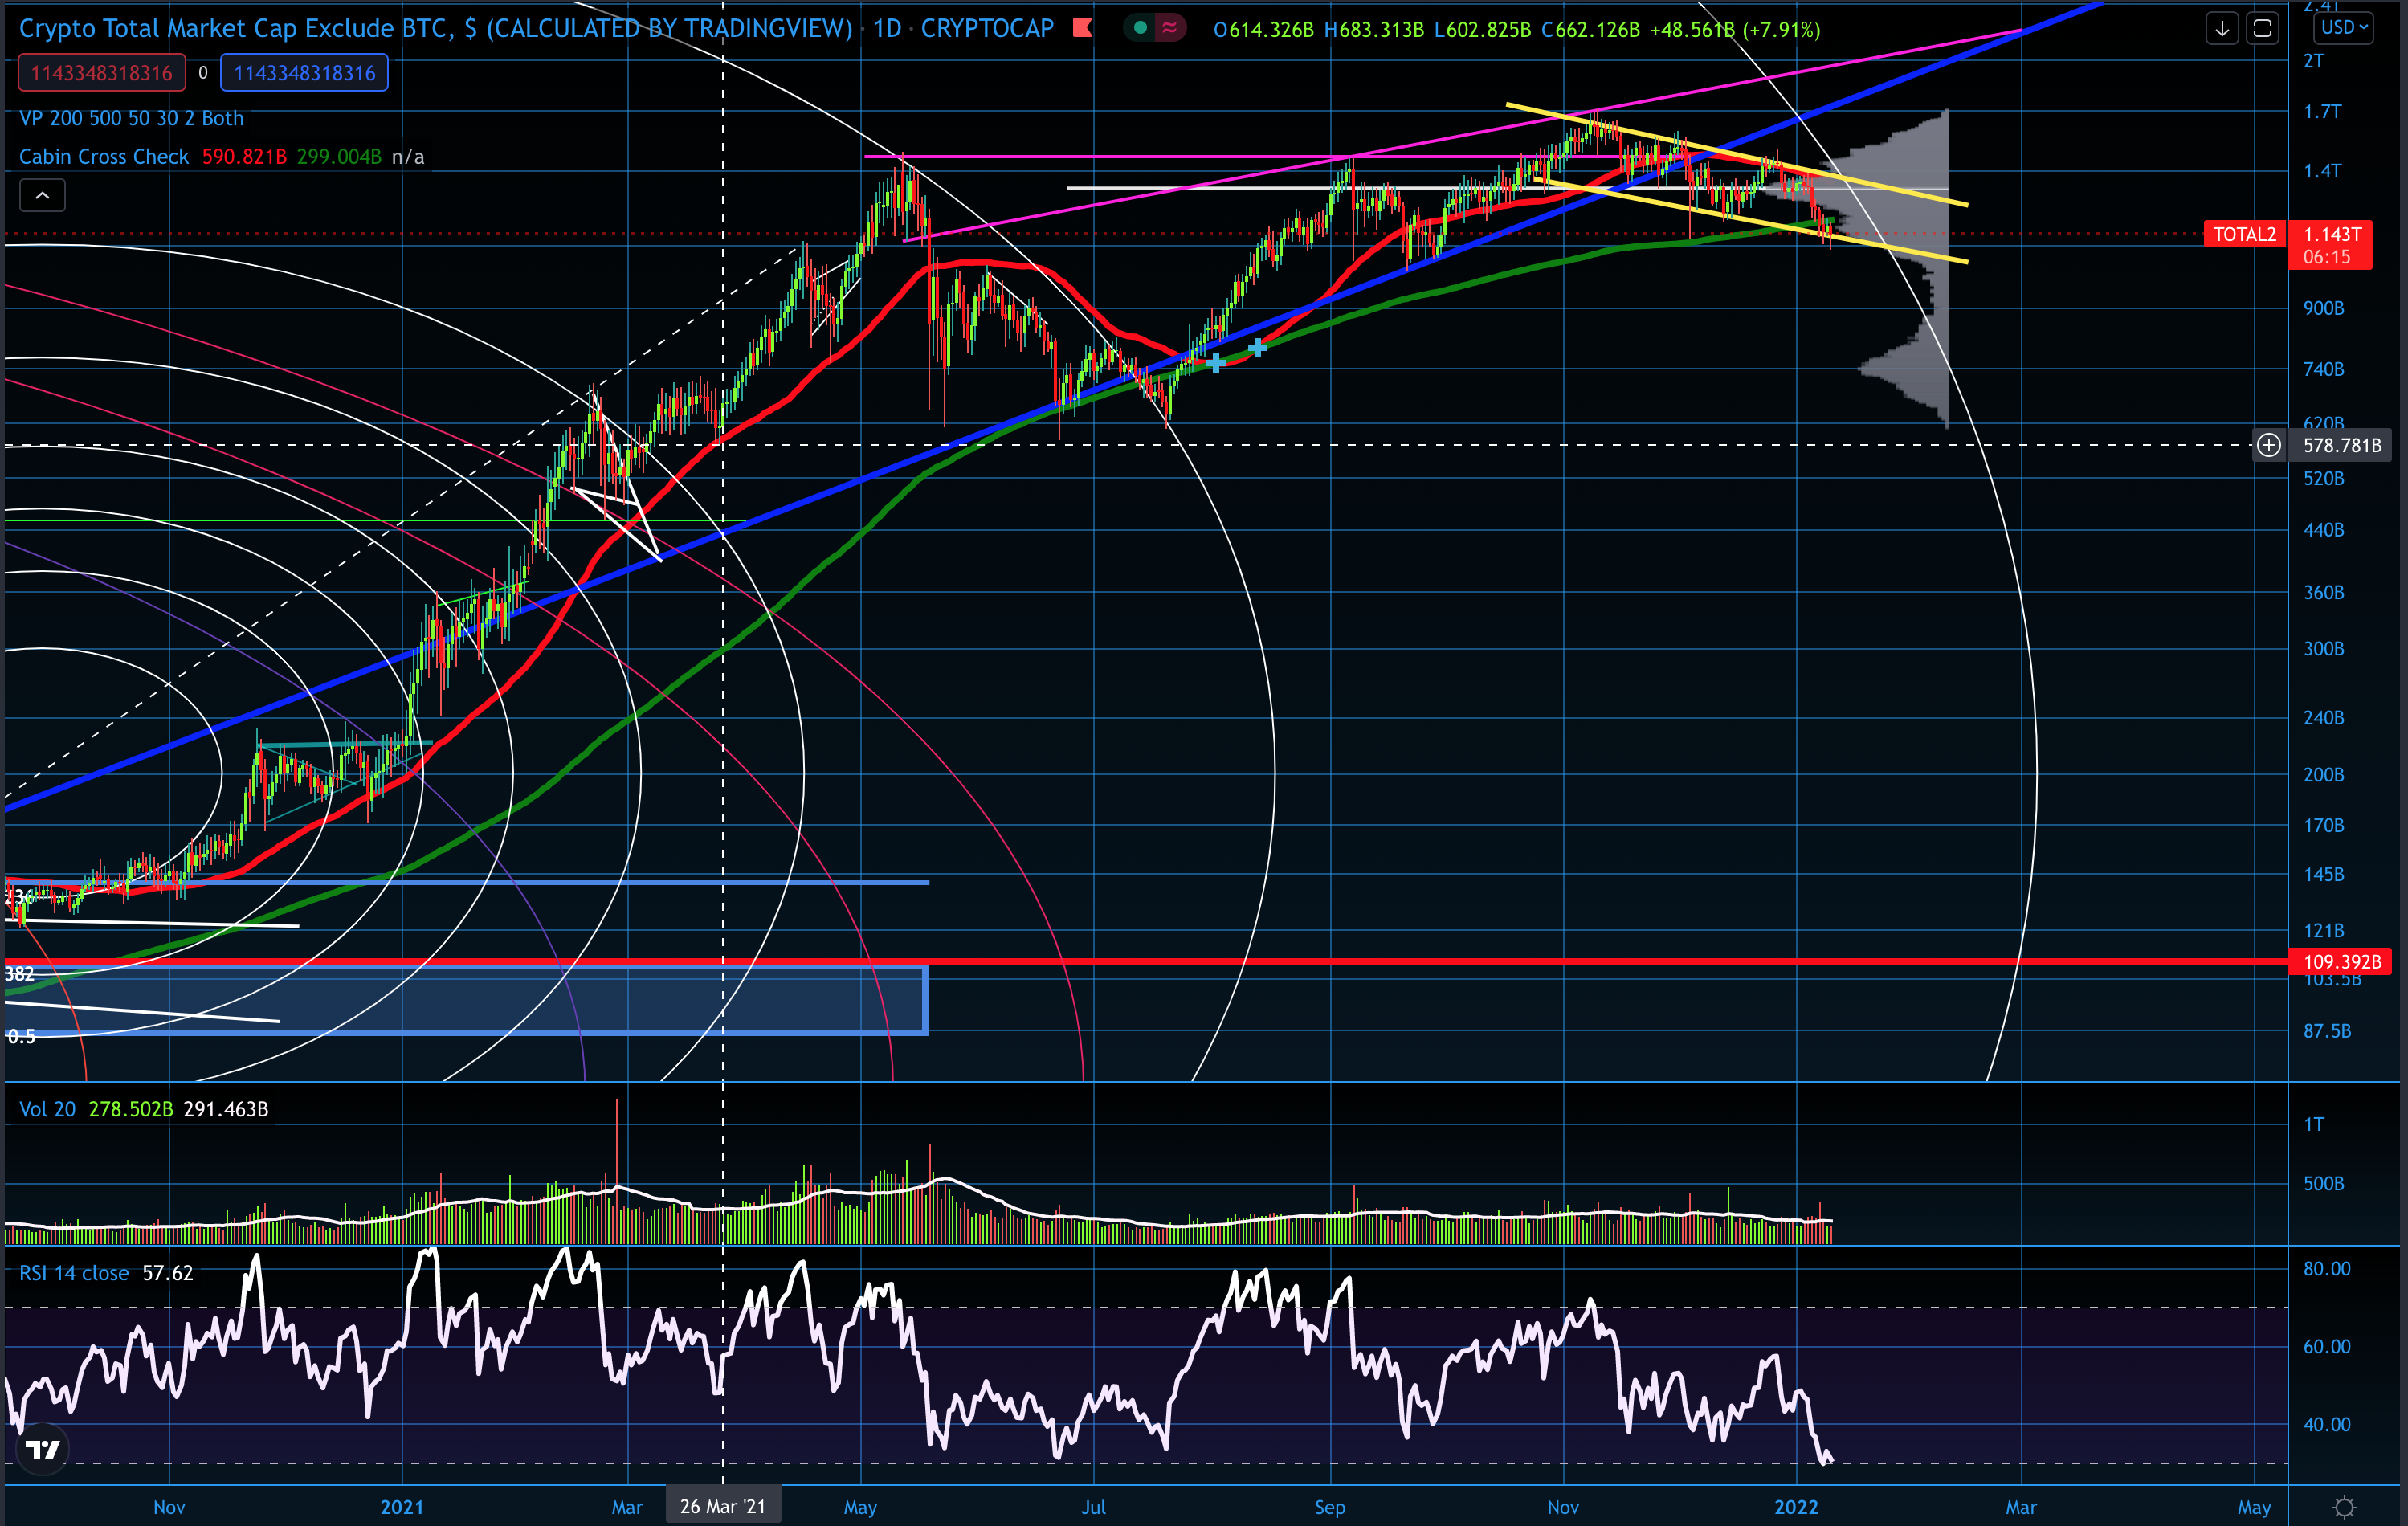
The TOTAL2 dipped under a long term support line out of what some might consider a rising wedge. However, the wedge only has 2 touches on top, most cases I look for 3 to solidify. What we do have confirmation on however, is the bull flag.
DEFIPERP
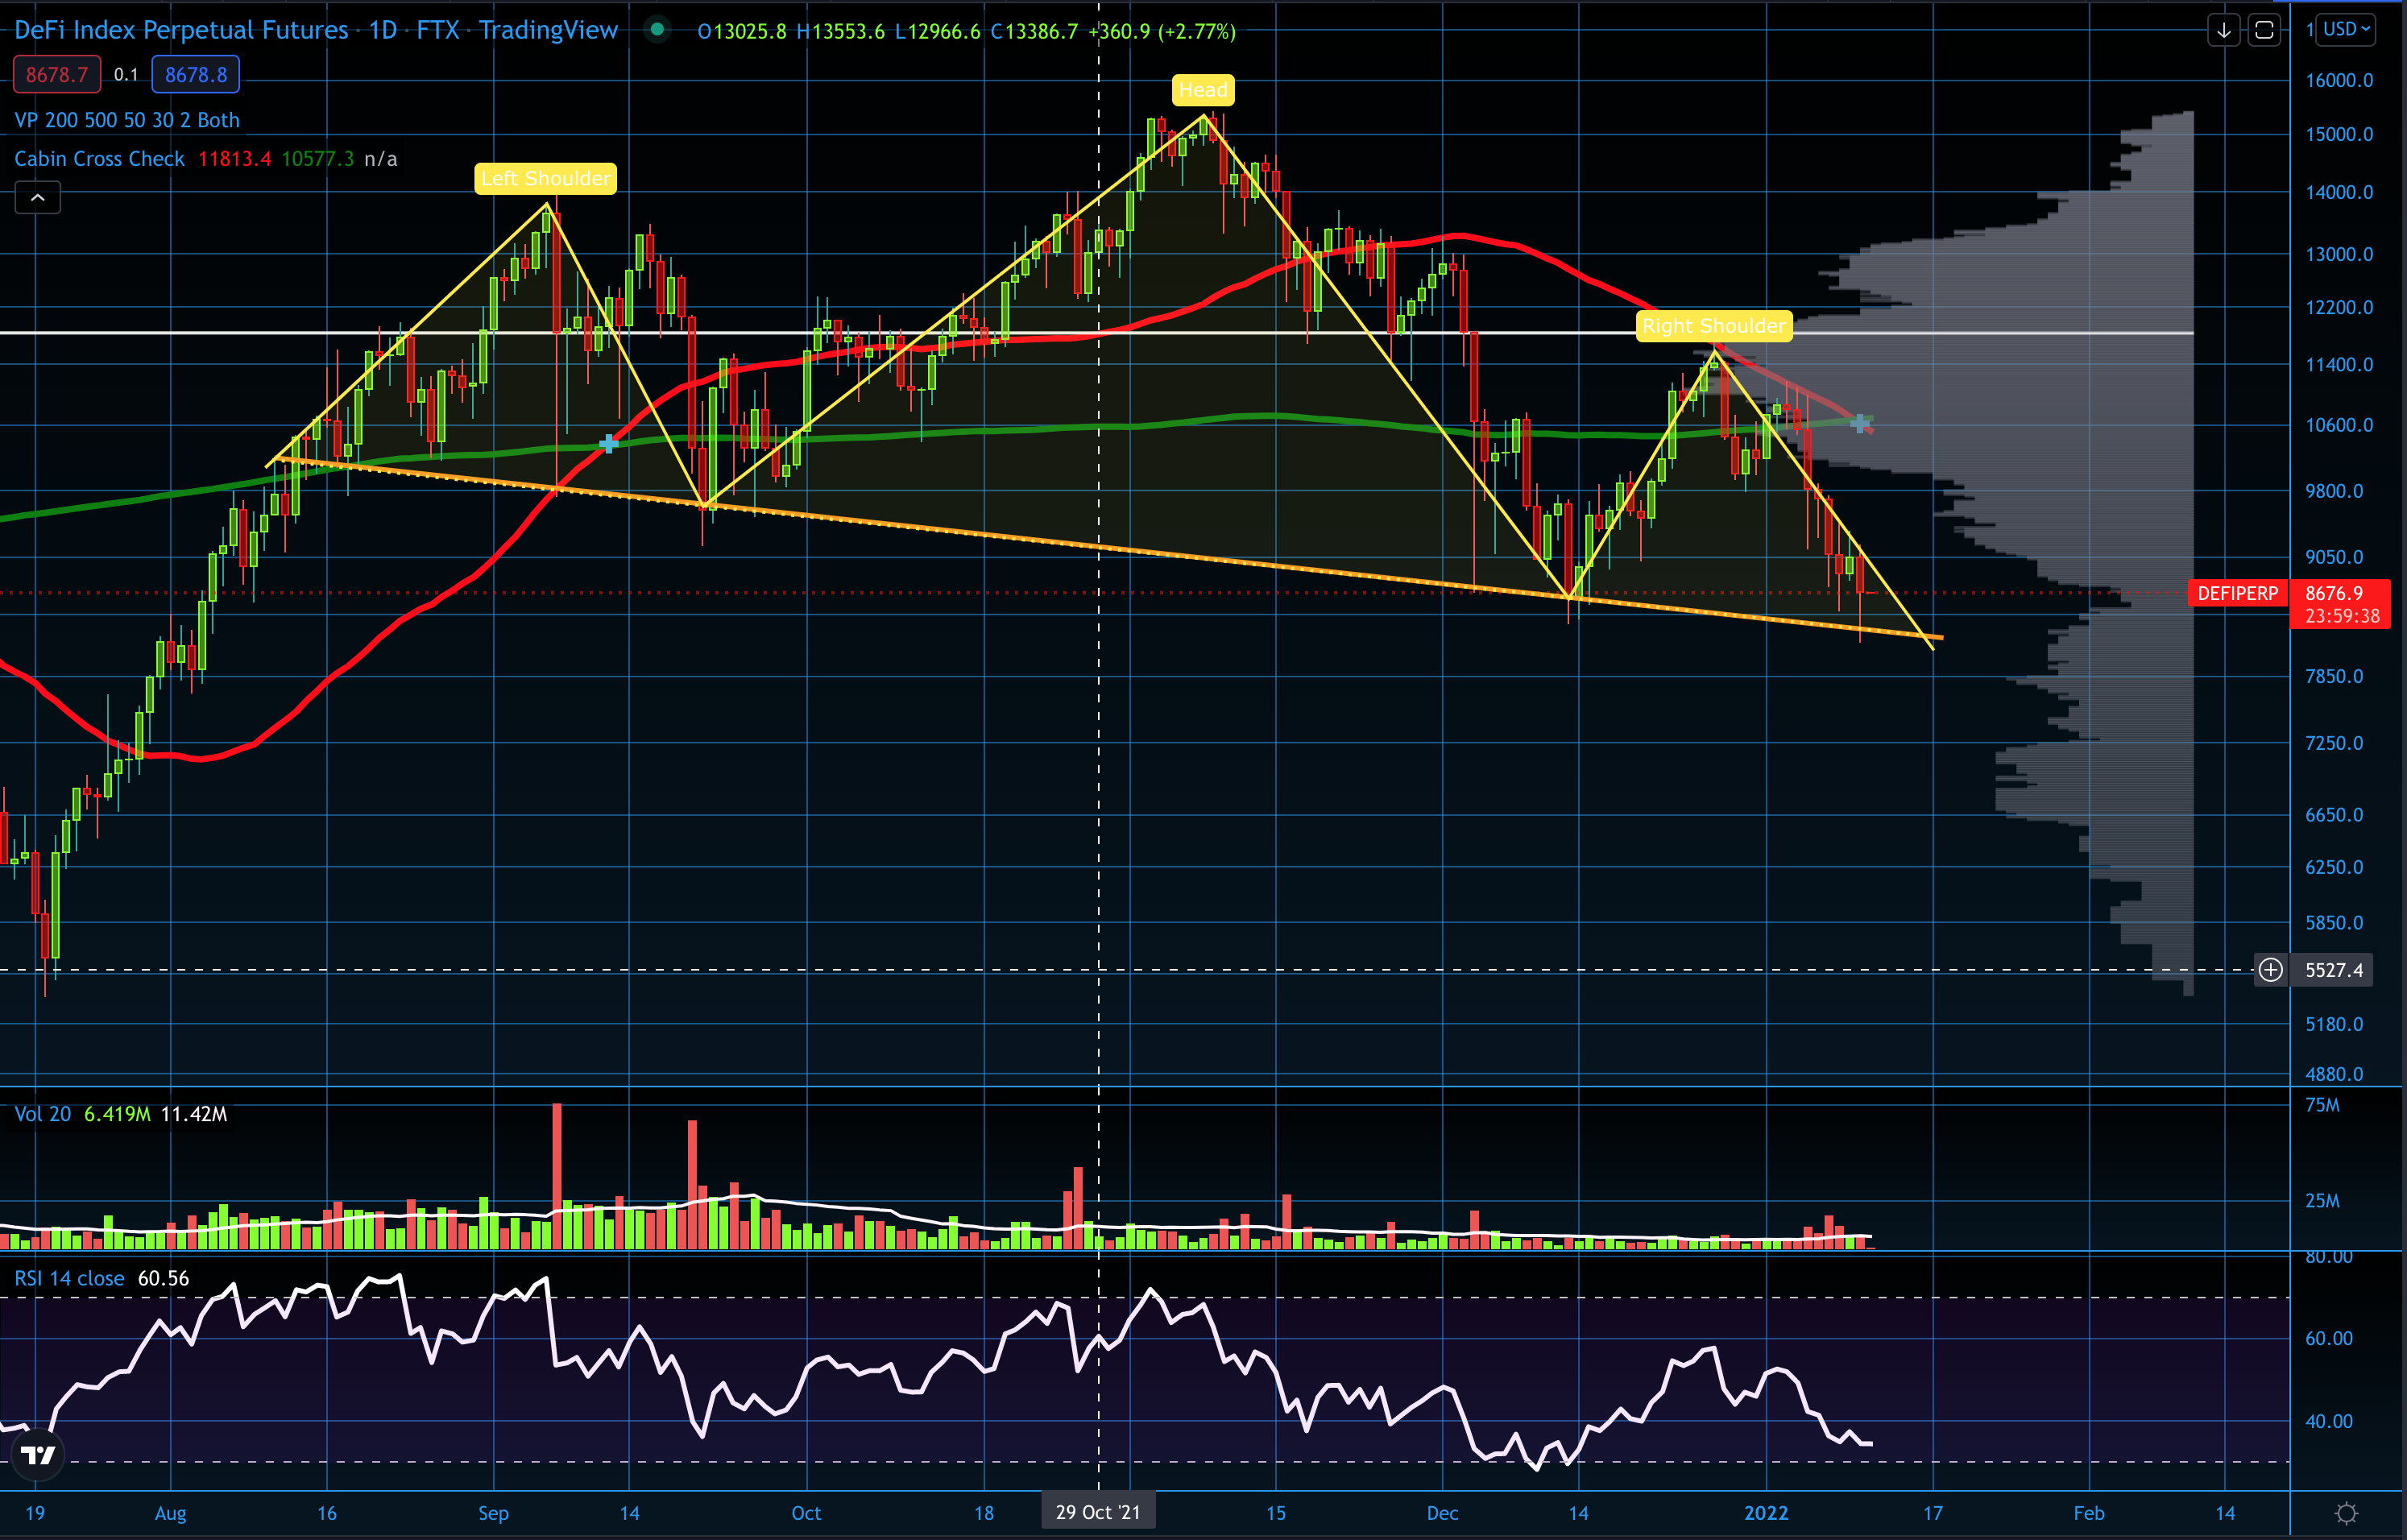
In the DEFI PERP we have more of a bearish case as this H&S is much more regular. From a technical stand point however, we still do not have a final right shoulder end touch. A wick, but not a touch. If the rest of the market is faking out as previously analyzed, DEFI will very likely invalidate this pattern.
Note that on 2 of the posted charts we are approaching a fib ring. I believe this to be the real resistance pushing the market down. I have some other charts that are also close to a similar fib ring.
Let’s look at a couple ALT’s
SOV/USD
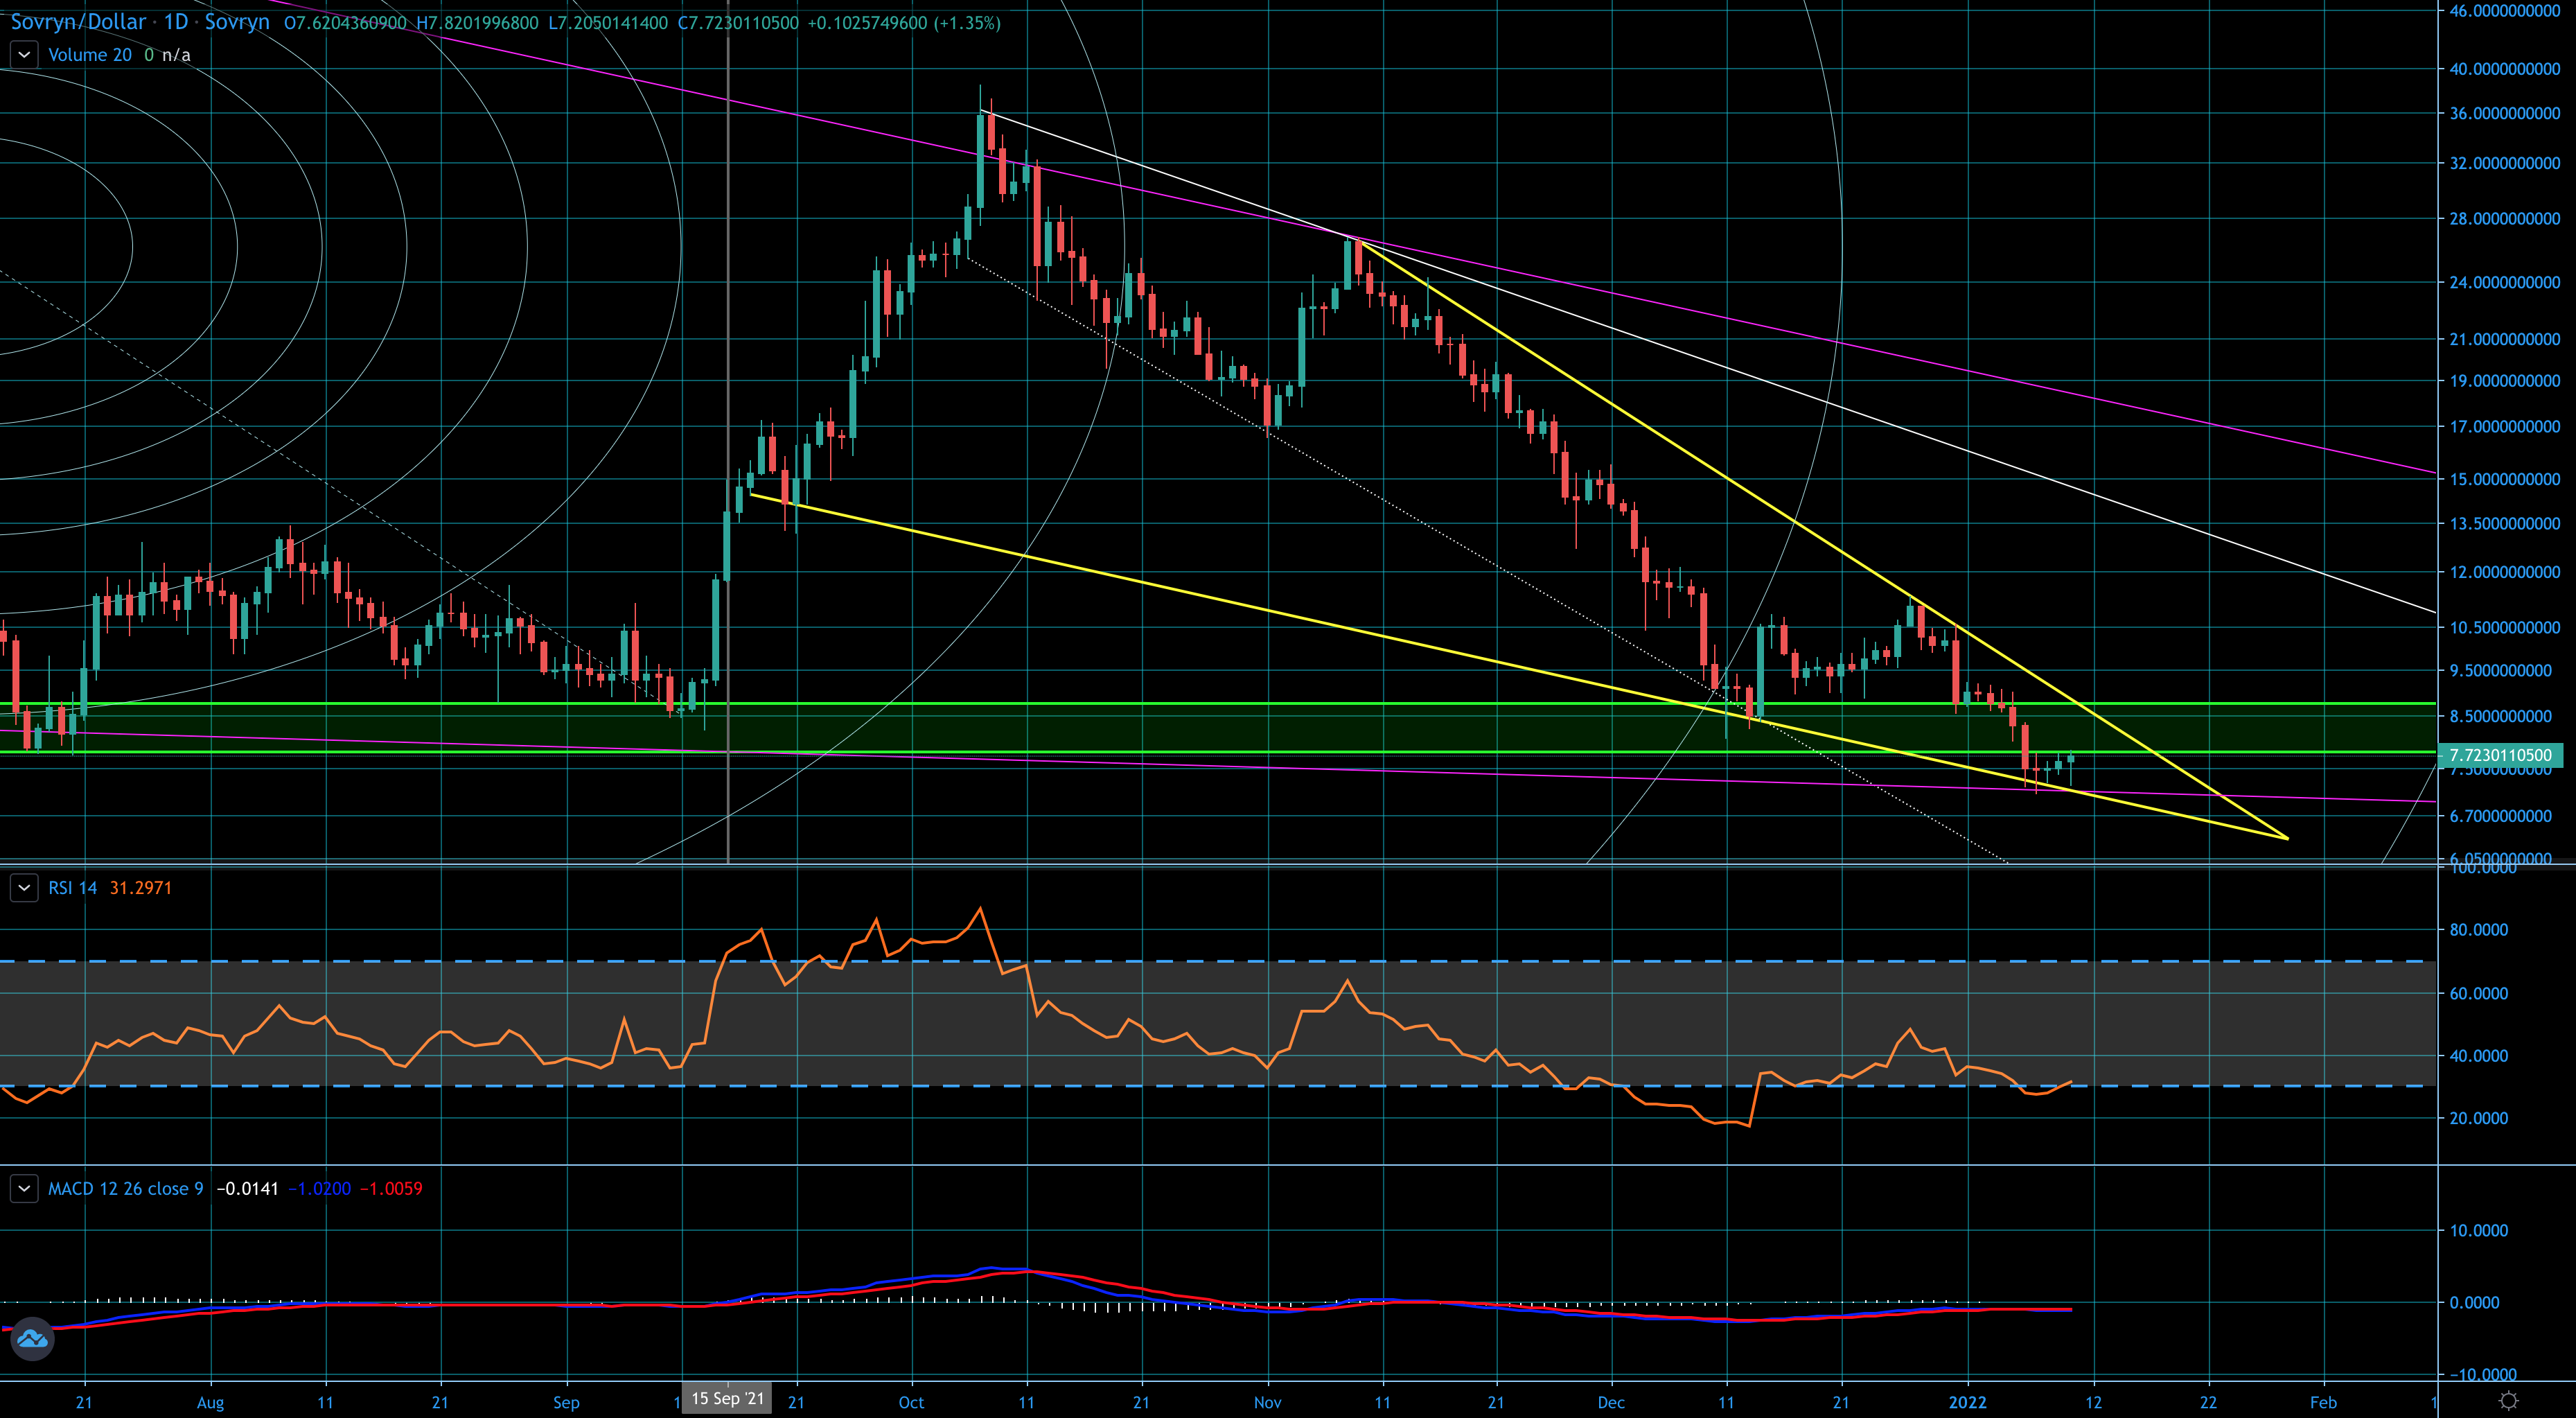
Again we have a descending wedge. The trend continues… This again is a bullish pattern as they break bullish most of the time. This is why I am advocating to hold and buy if you are looking to get in on the ground floor for a longer term investment. These are great levels to buy Sovryn at. Read more on it here.
BOSON/USD
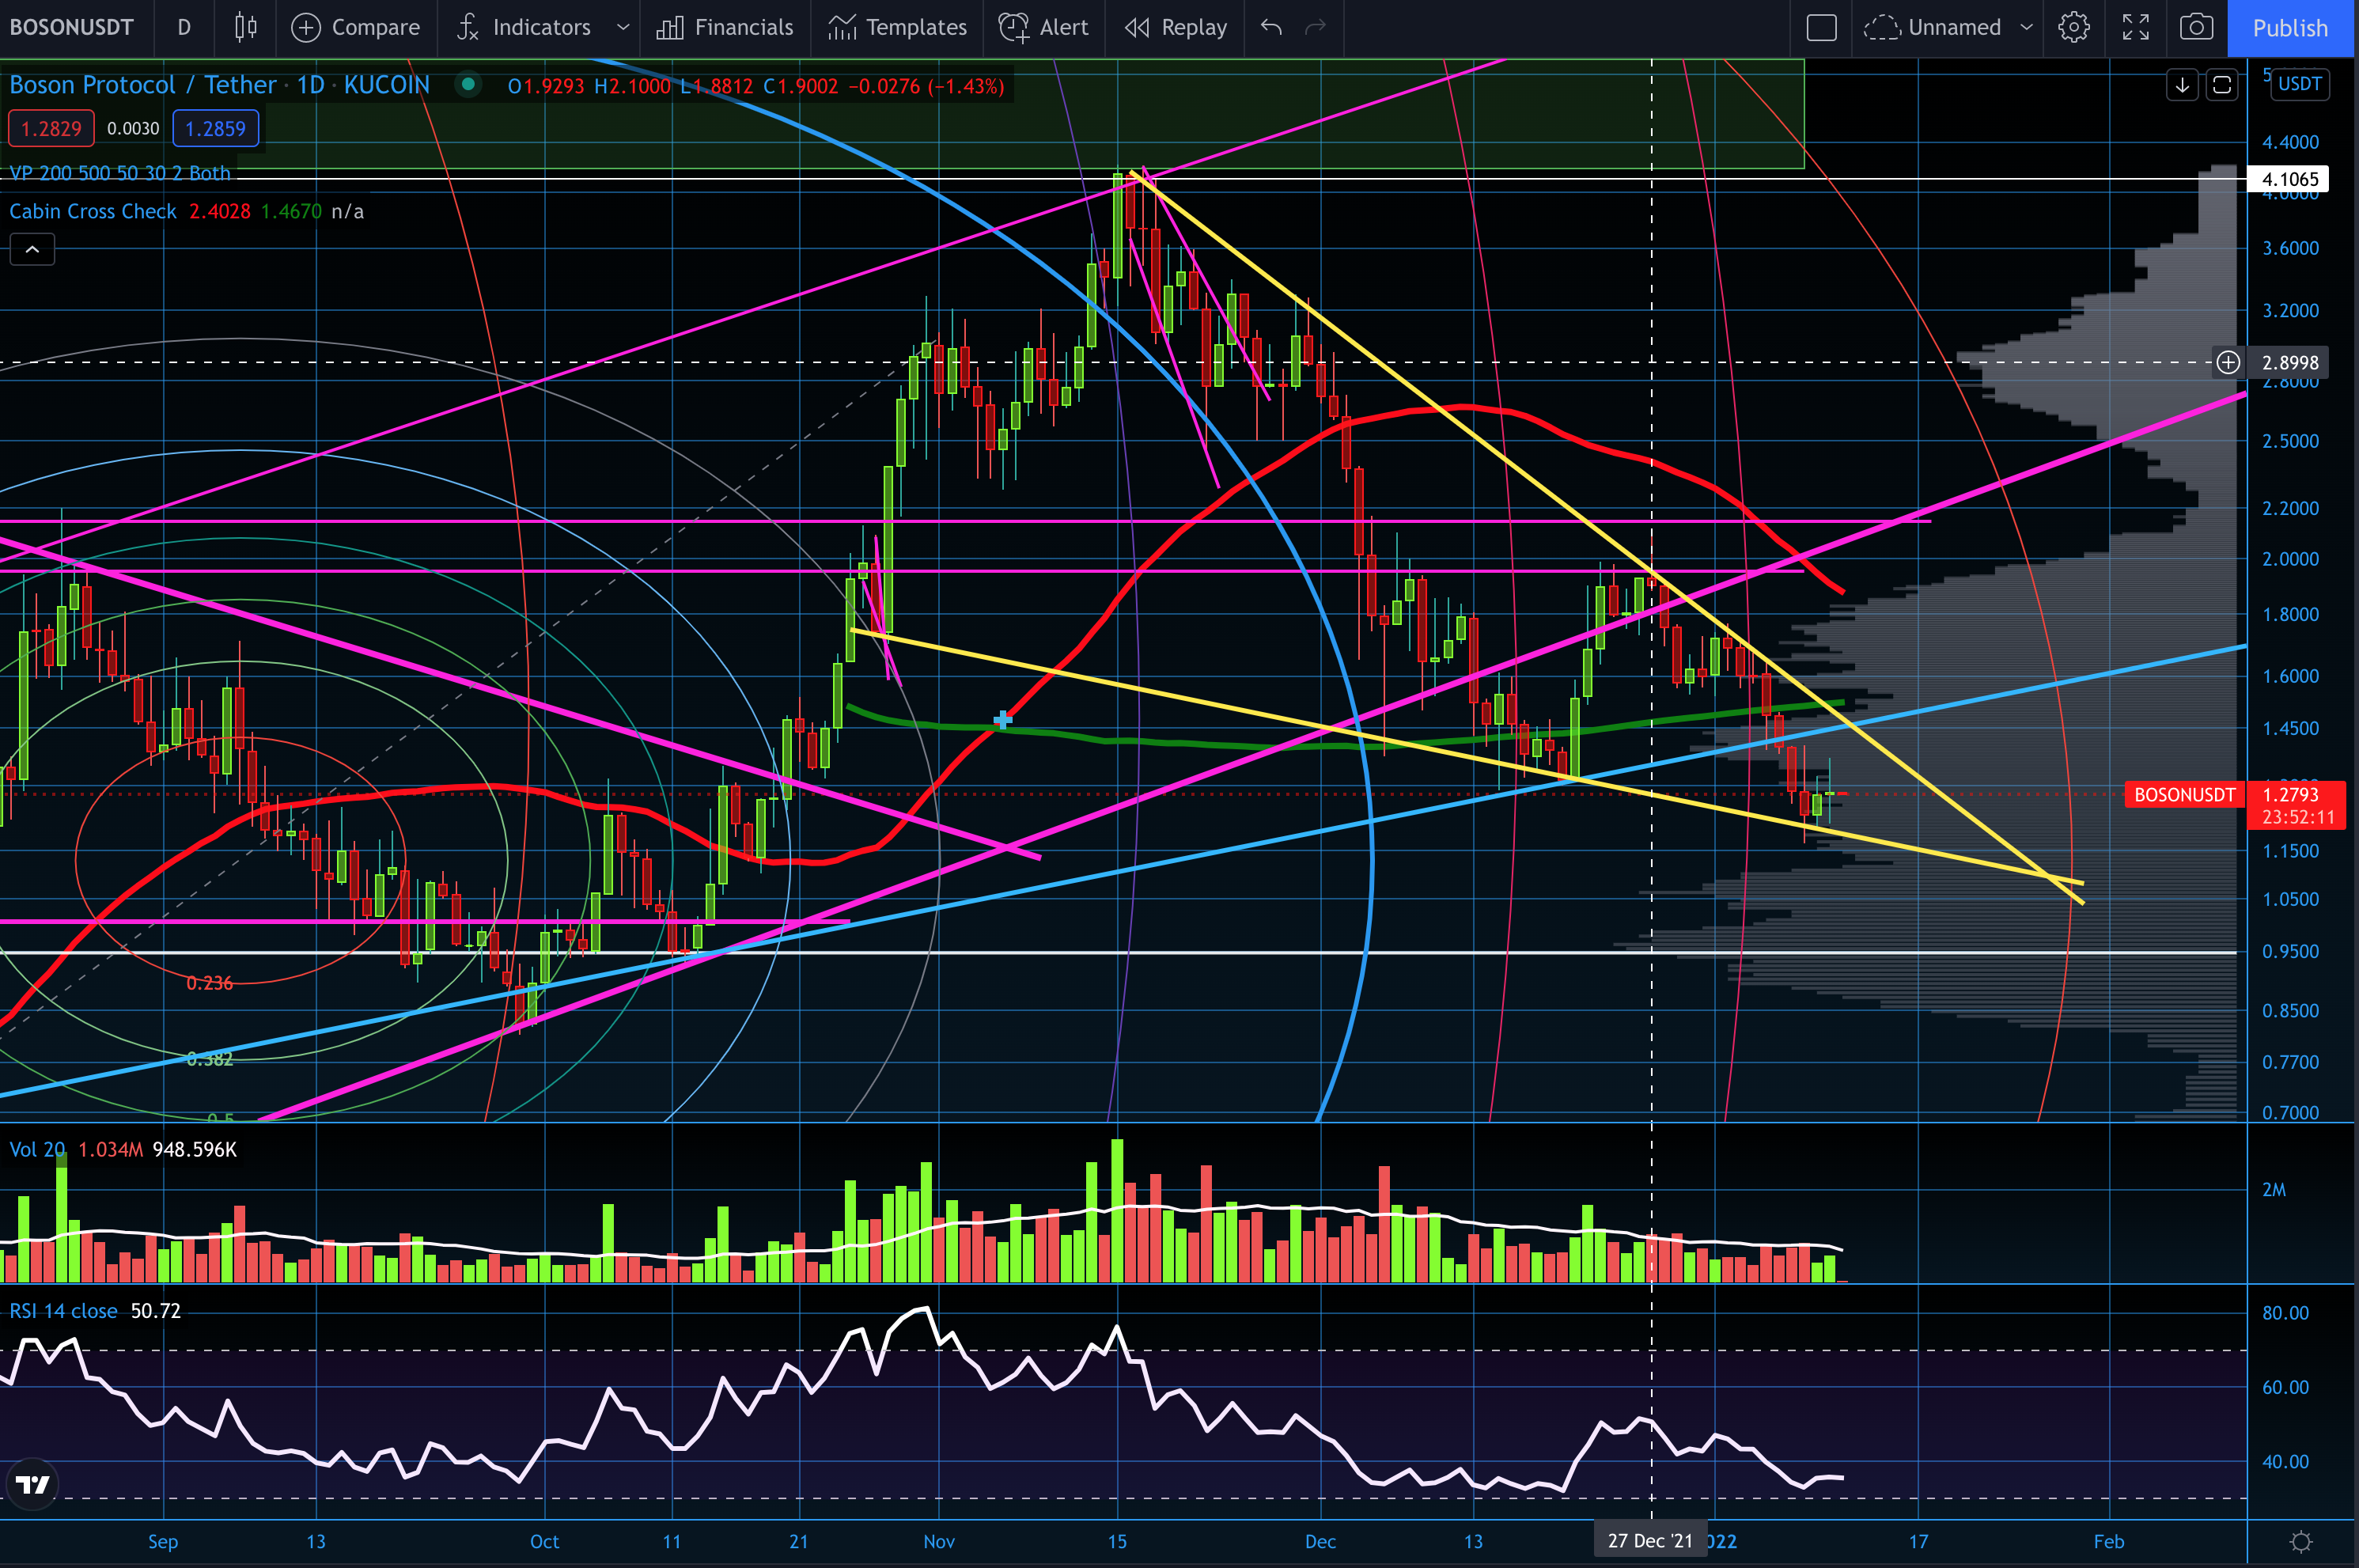
Again, more of the same trend on the low cap front. Descending wedges all around. Why? From a technical standpoint it seems to me that there is more going on in the market than meets the eye. If you are looking for a solid NFT play low cap, this is the ticket.
DUSK/USD
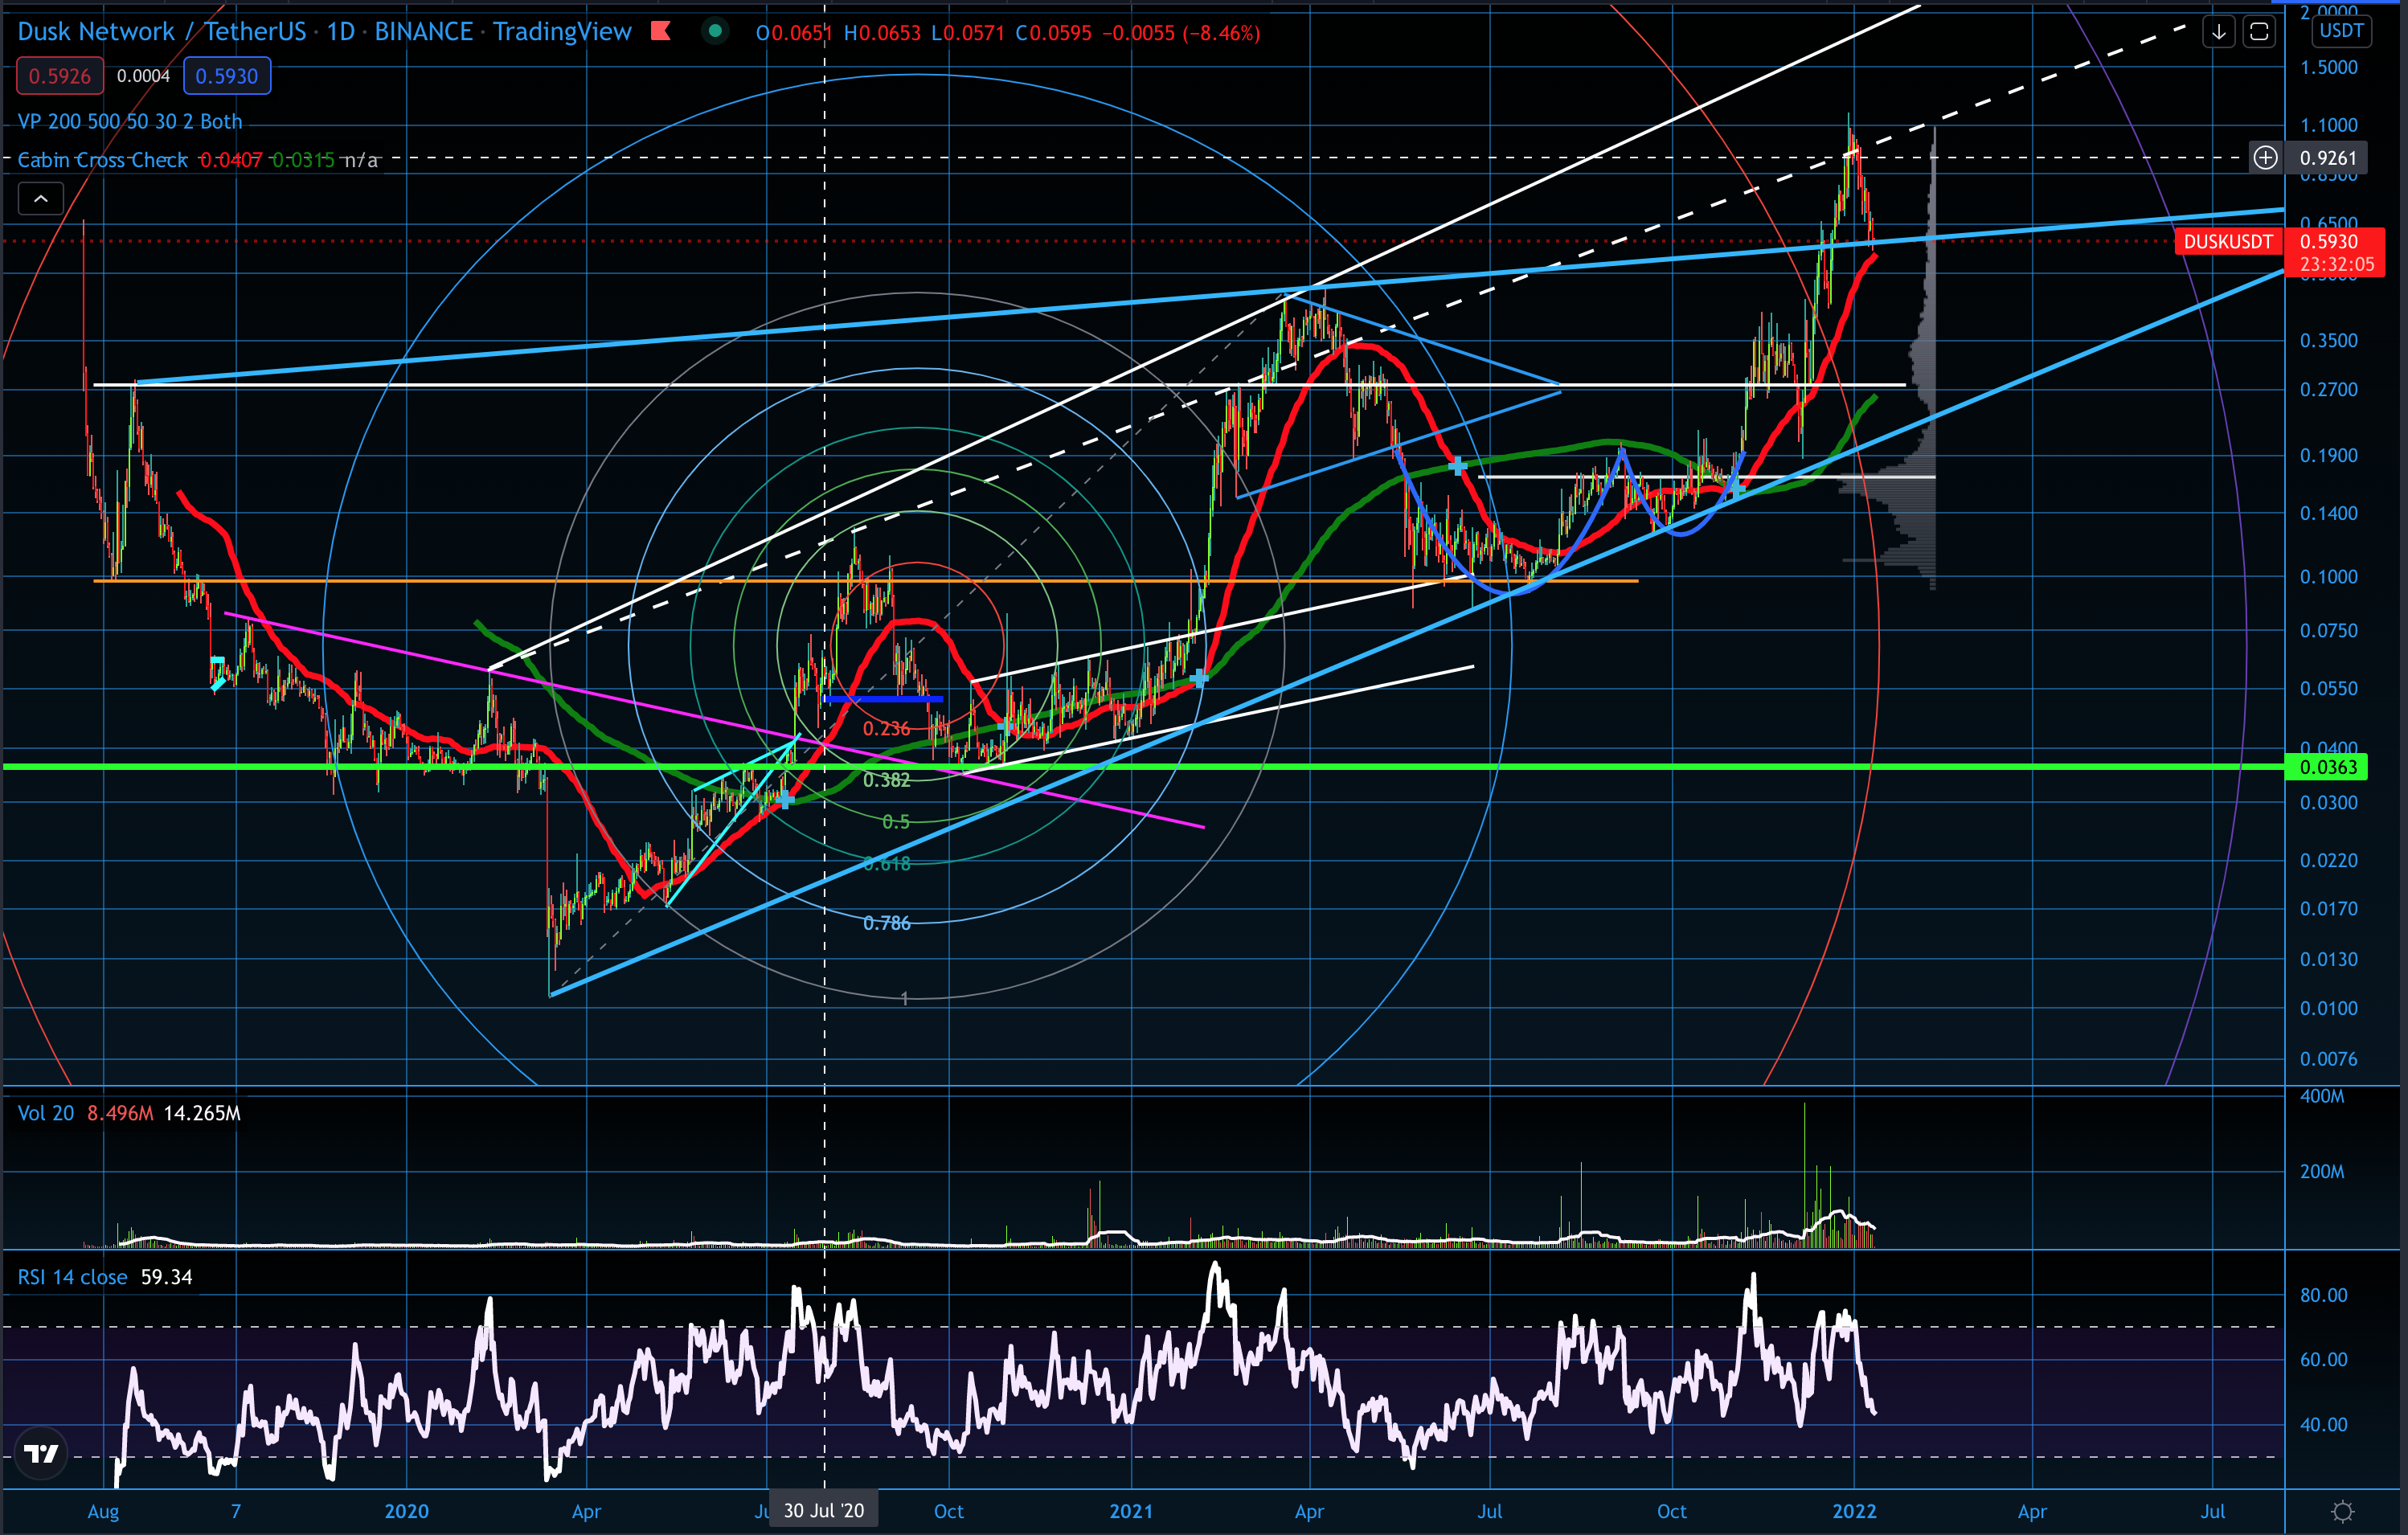
Dusk is a bit of an outlier here, it has been doing well while the rest of the market has been bleeding out. It broke out of a rising wedge which is very bullish. It is retesting the breakout now which could be a buy if we are going to approach this from an over all bullish standpoint in the greater market. More on DUSK here.
ICX/USD
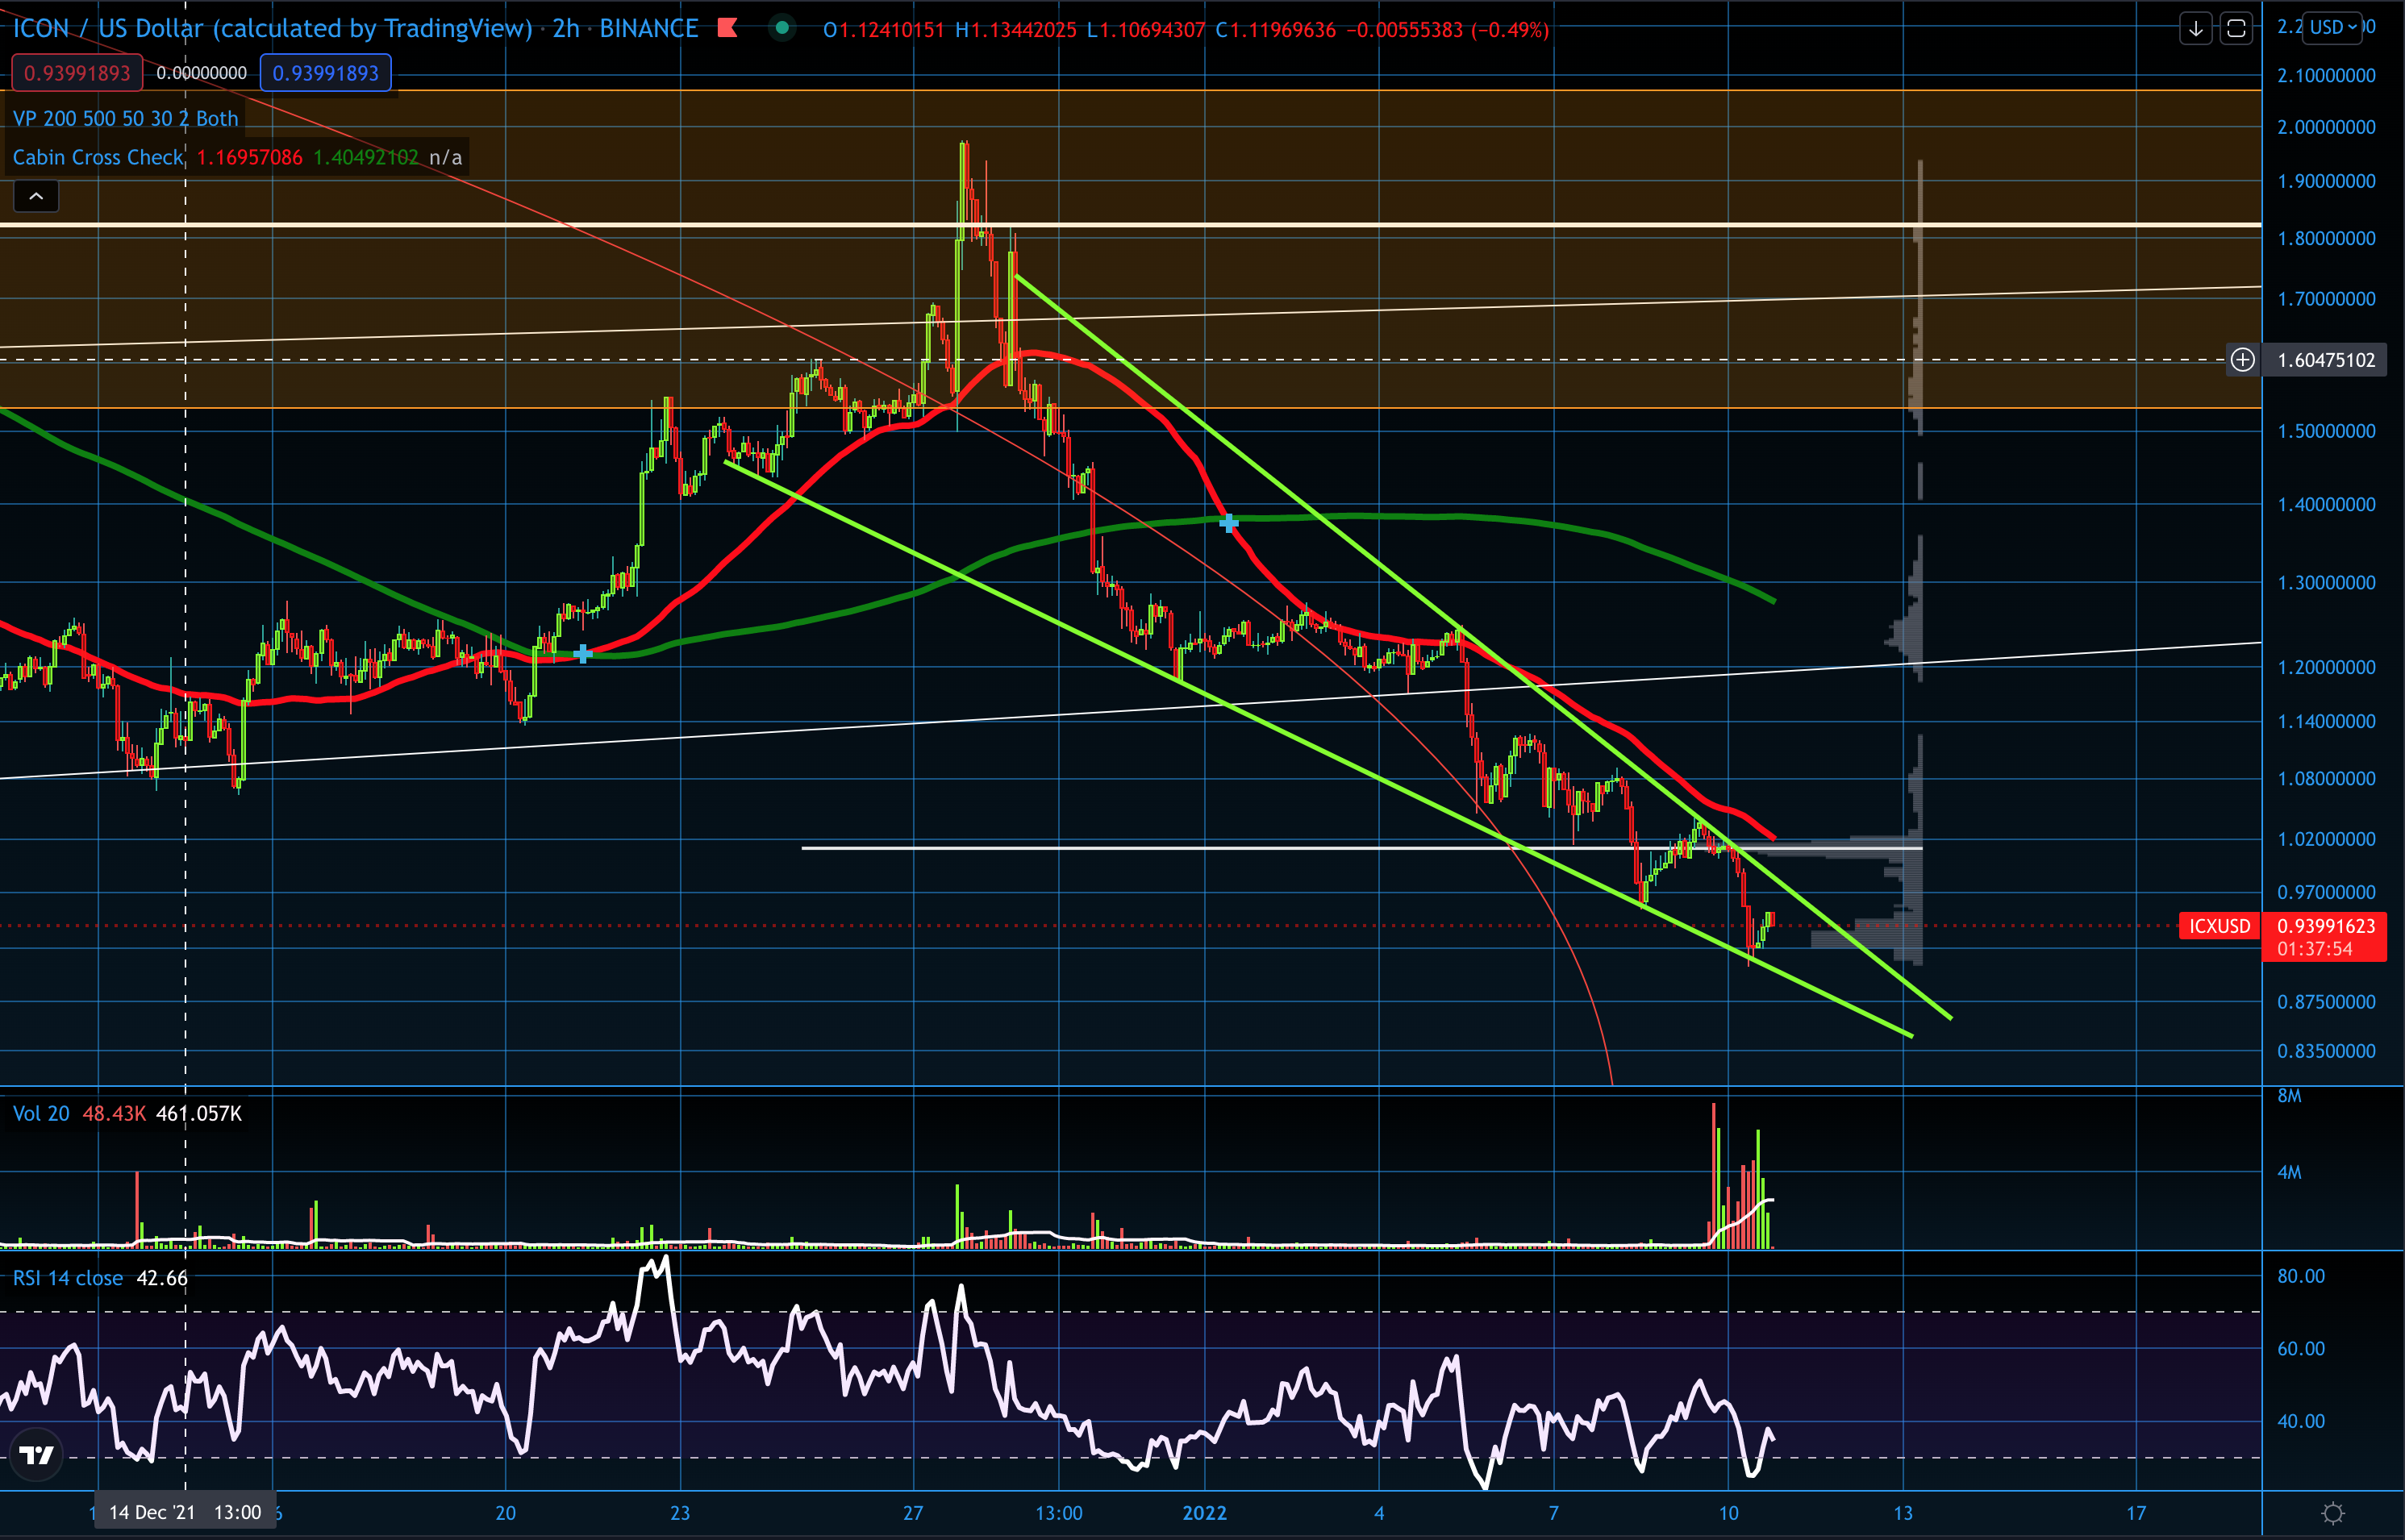
Yet again, Descending wedge on a more higher cap ICX. More on the project here.
ALGO/USD
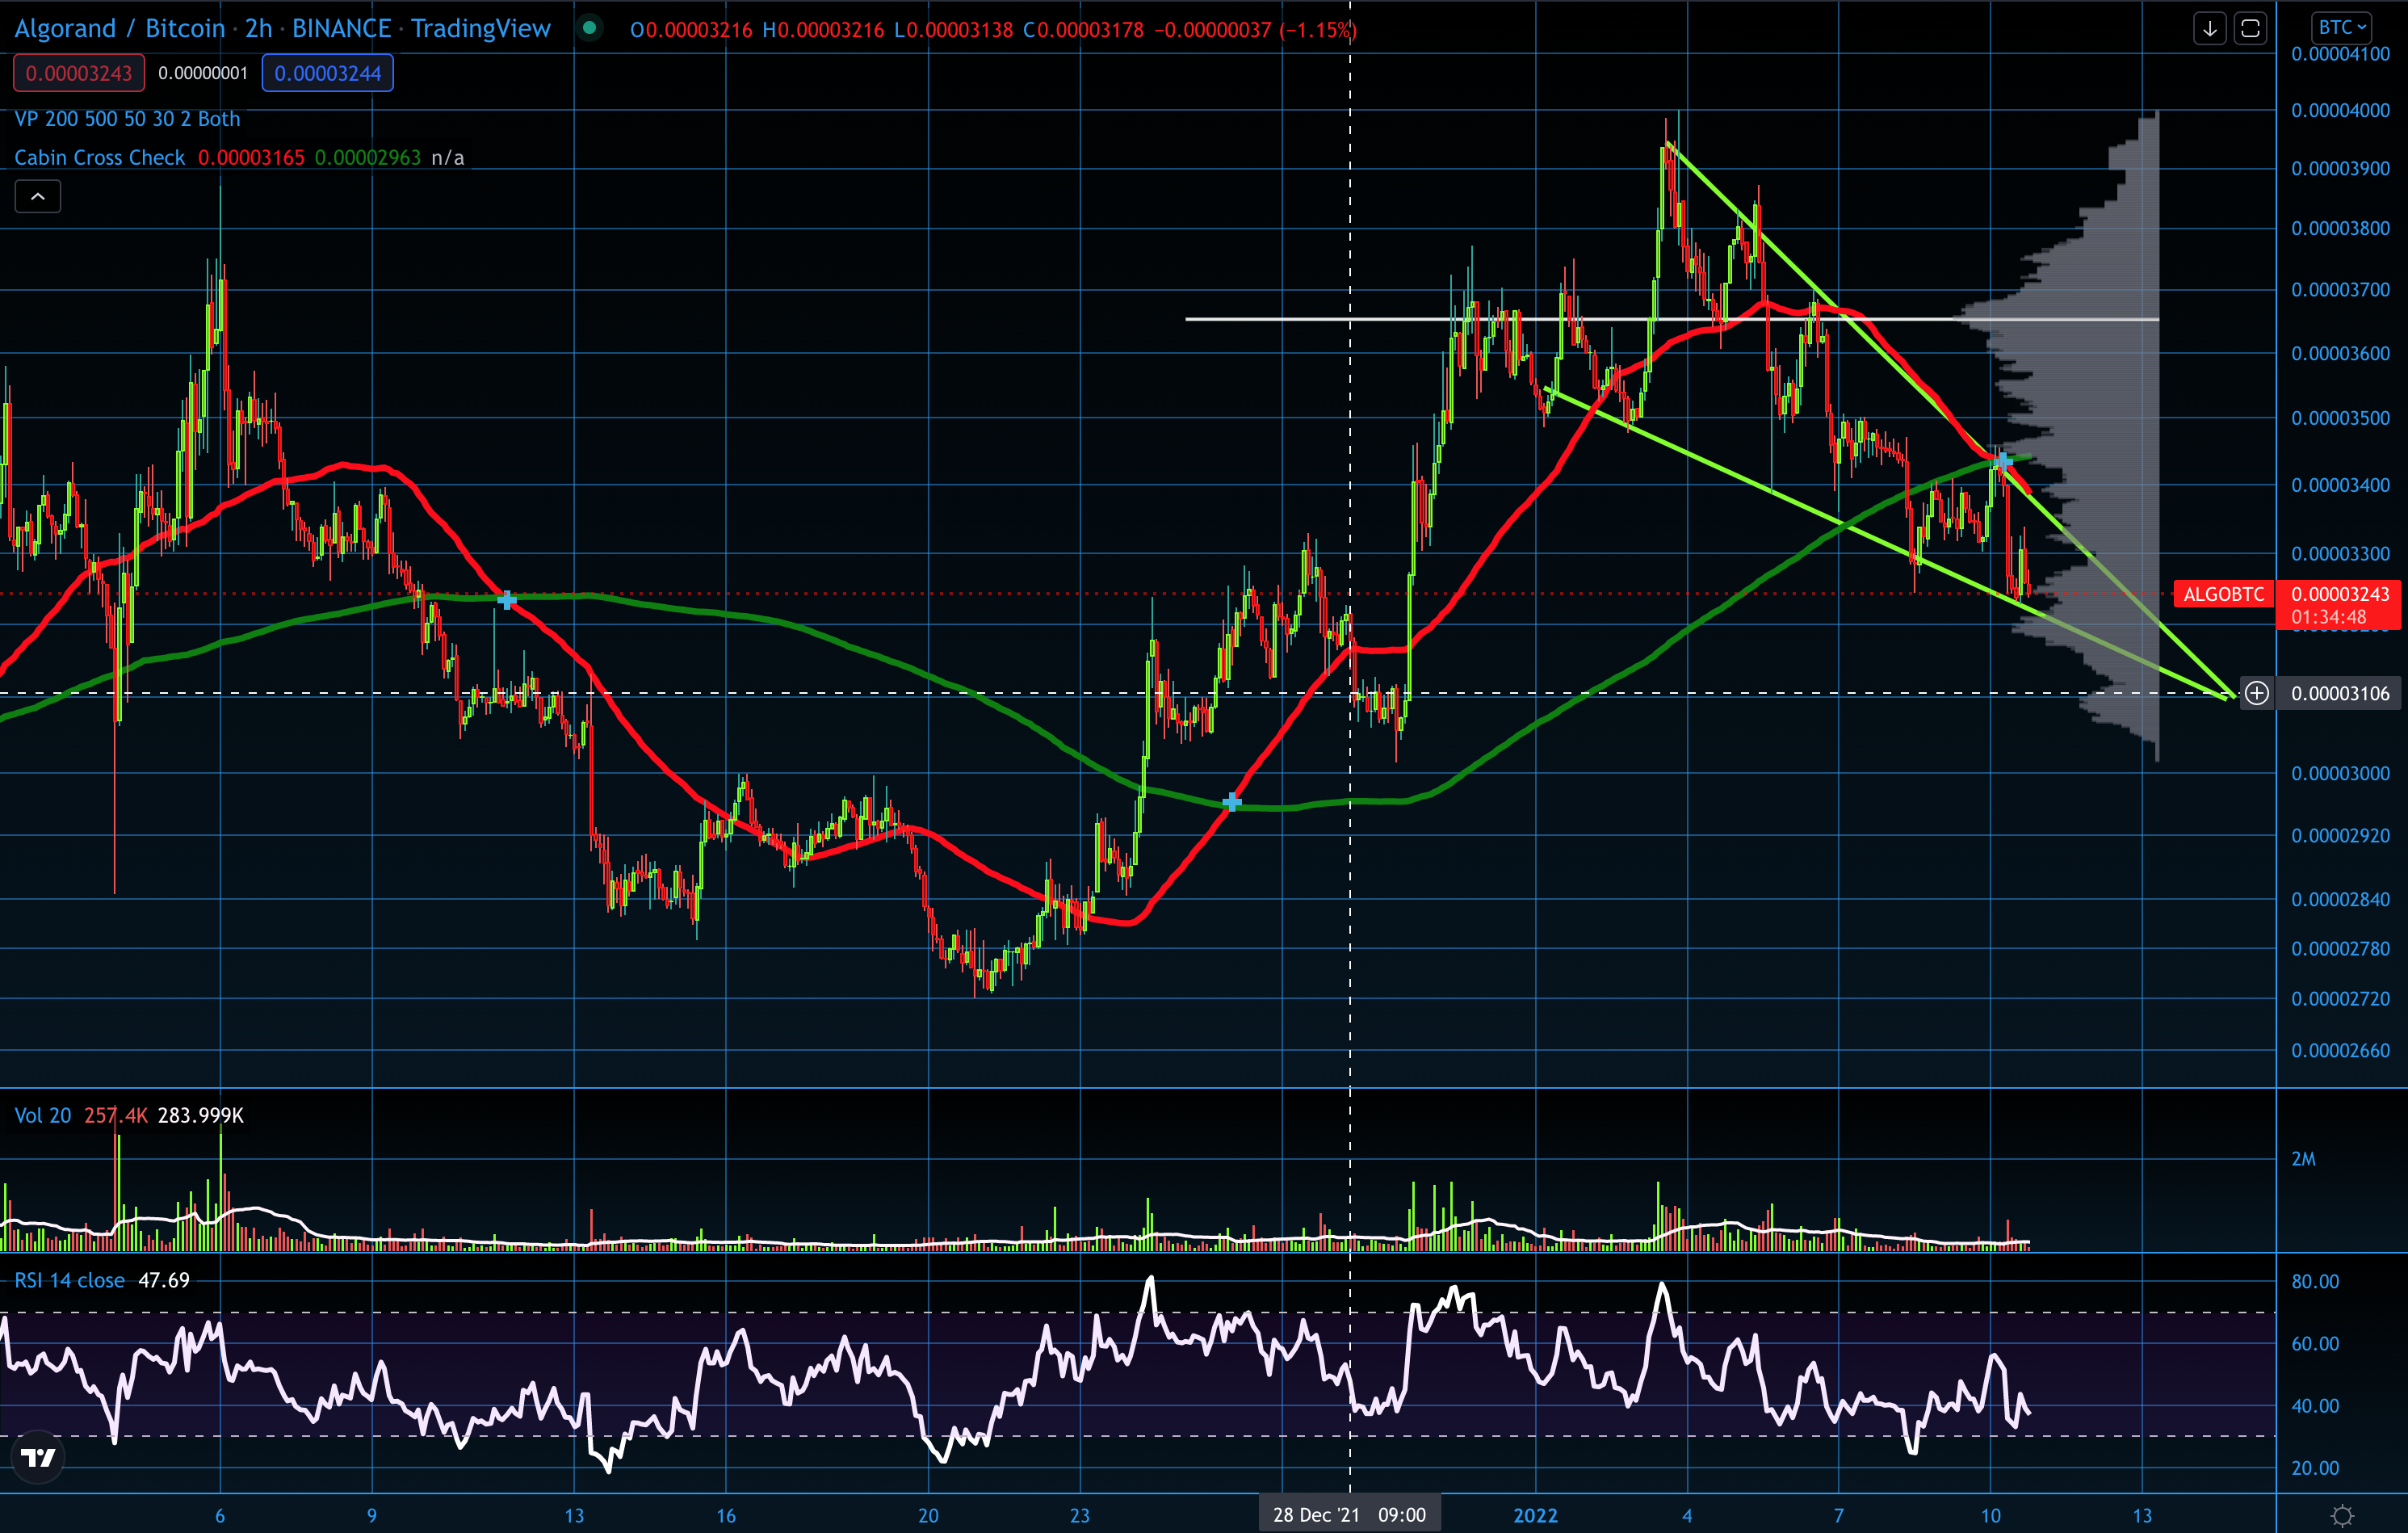
Another high cap, descending wedge.
Note that all of the RSI’s across all these charts are low or even downright exhausted.
Dominance Charts
BTC.D
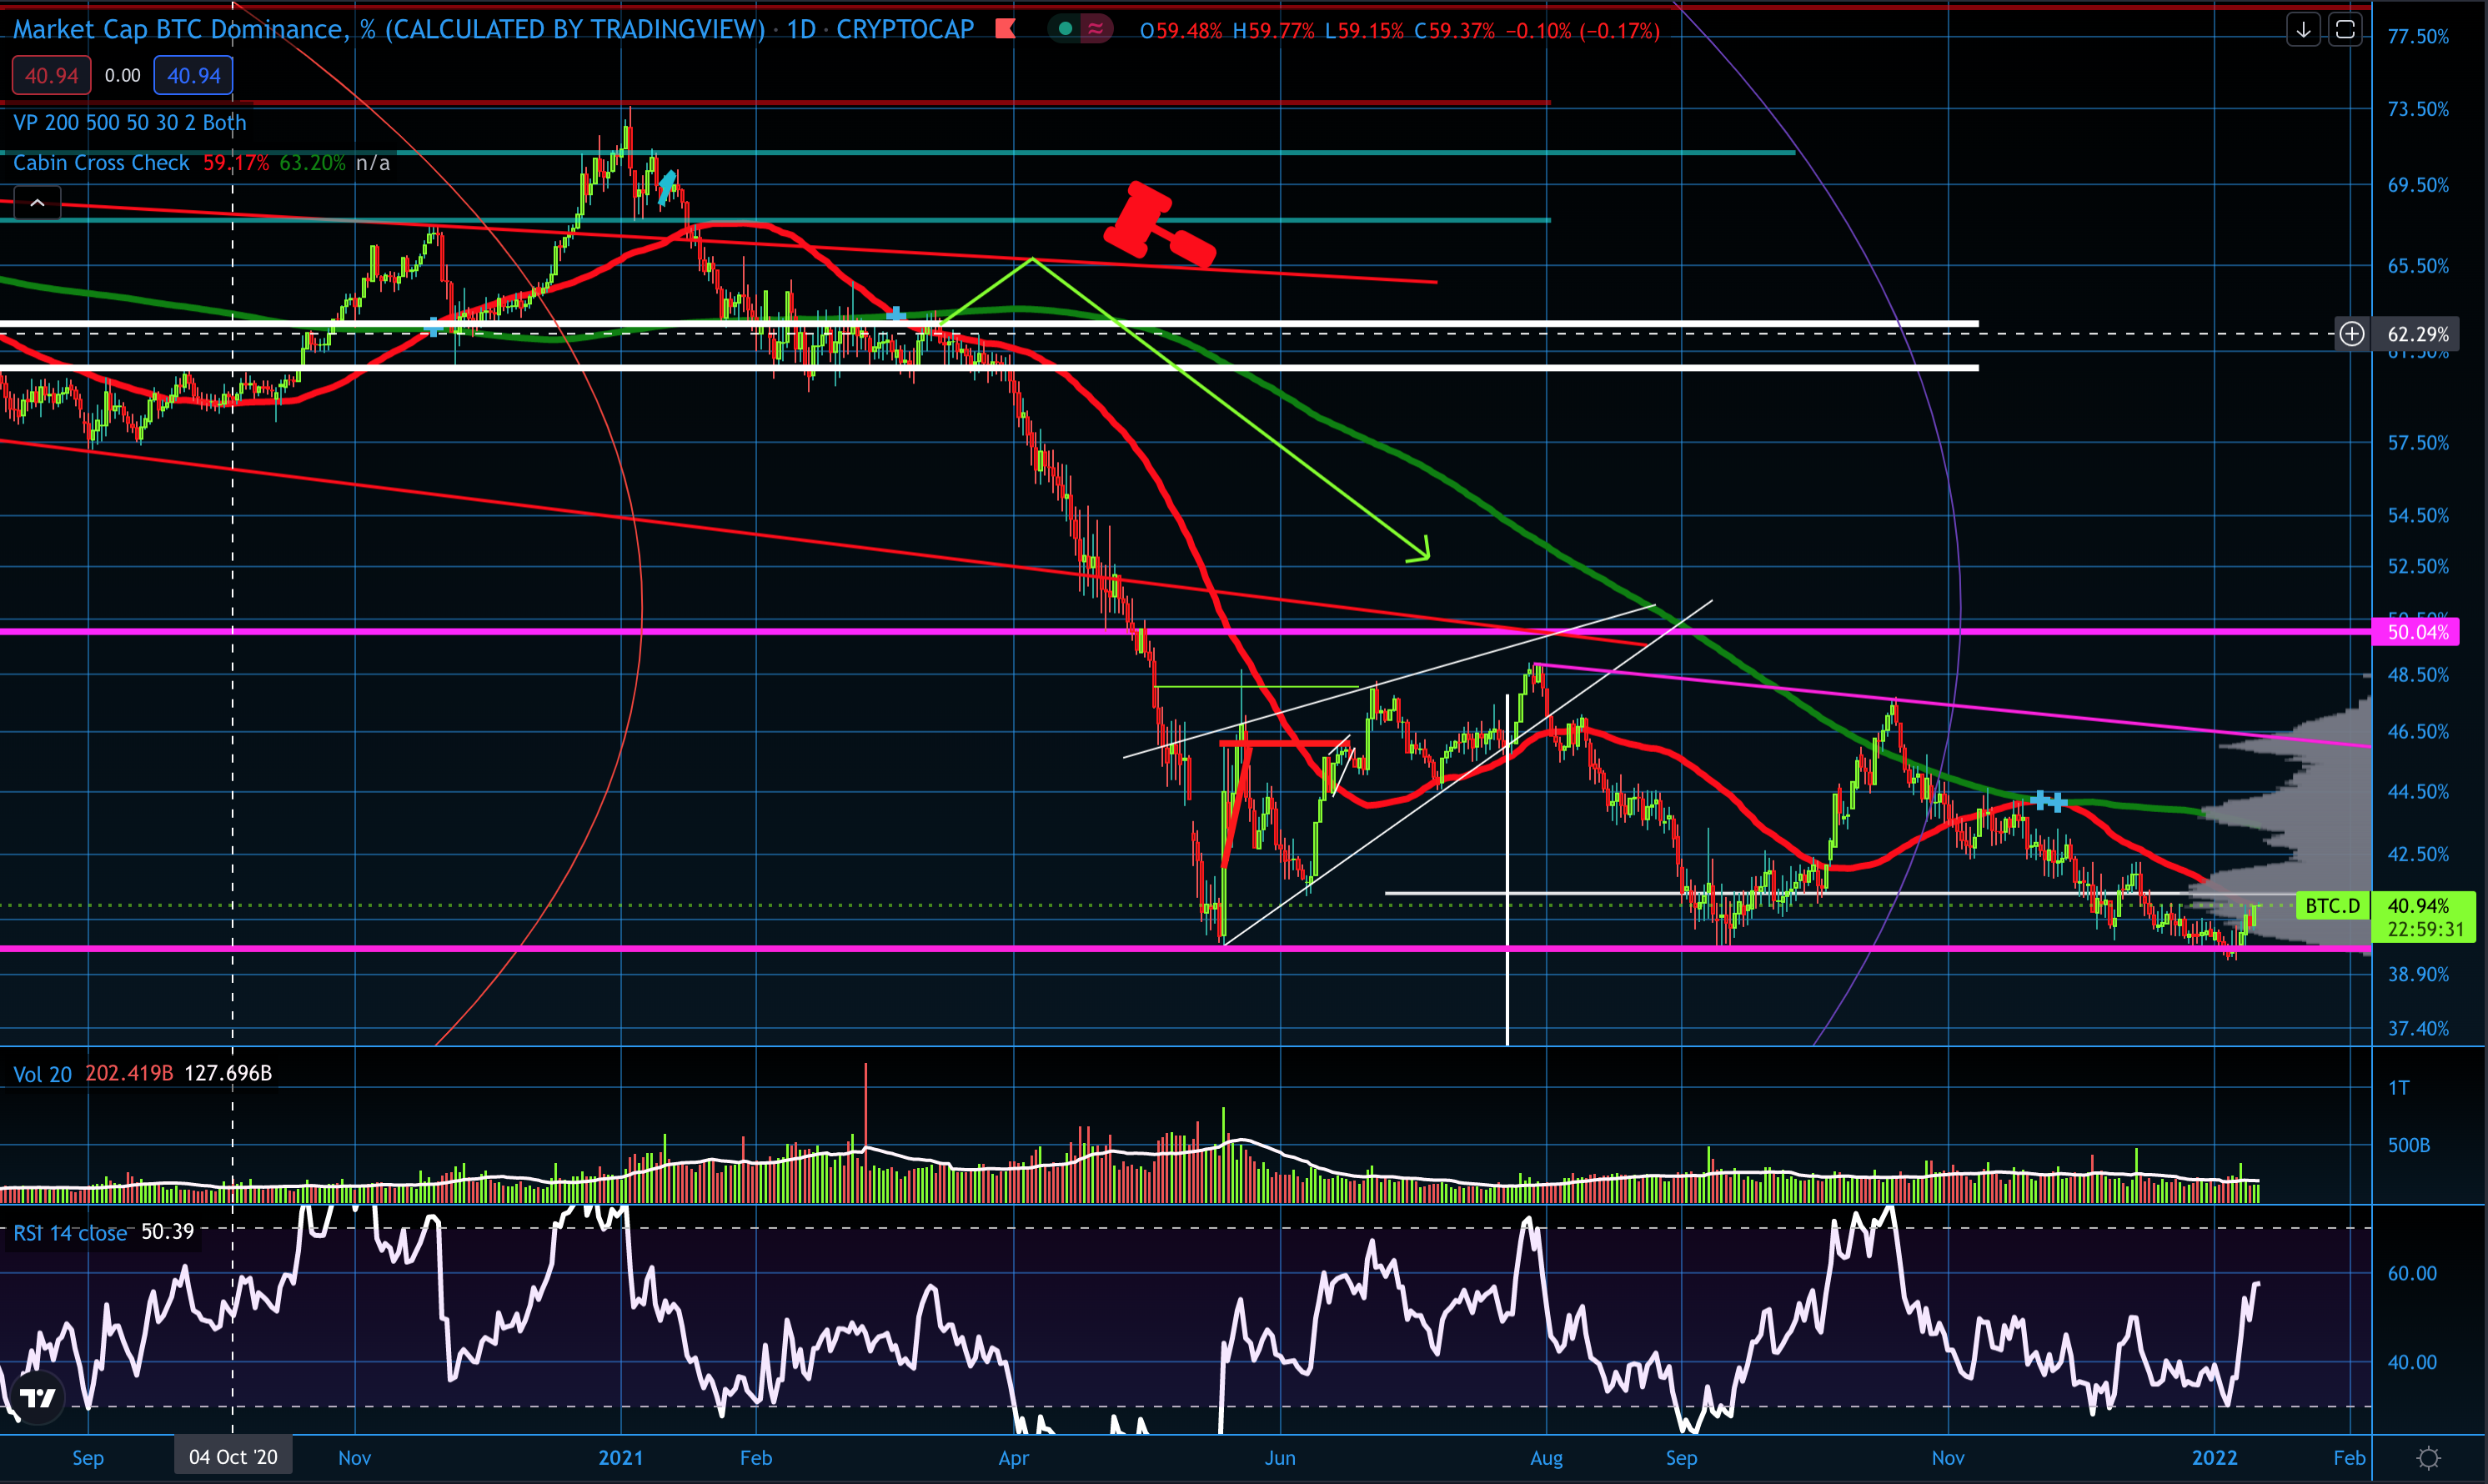
Bitcoin Dominance is not looking bearish to me here. It is macro down trending, tested support 3 times and is about to hit a bit of resistance on the VPVR. It looks like it may want to continue trending down after some sideways movement. The RSI is running hot on a weak move upward.
OTHERS.D
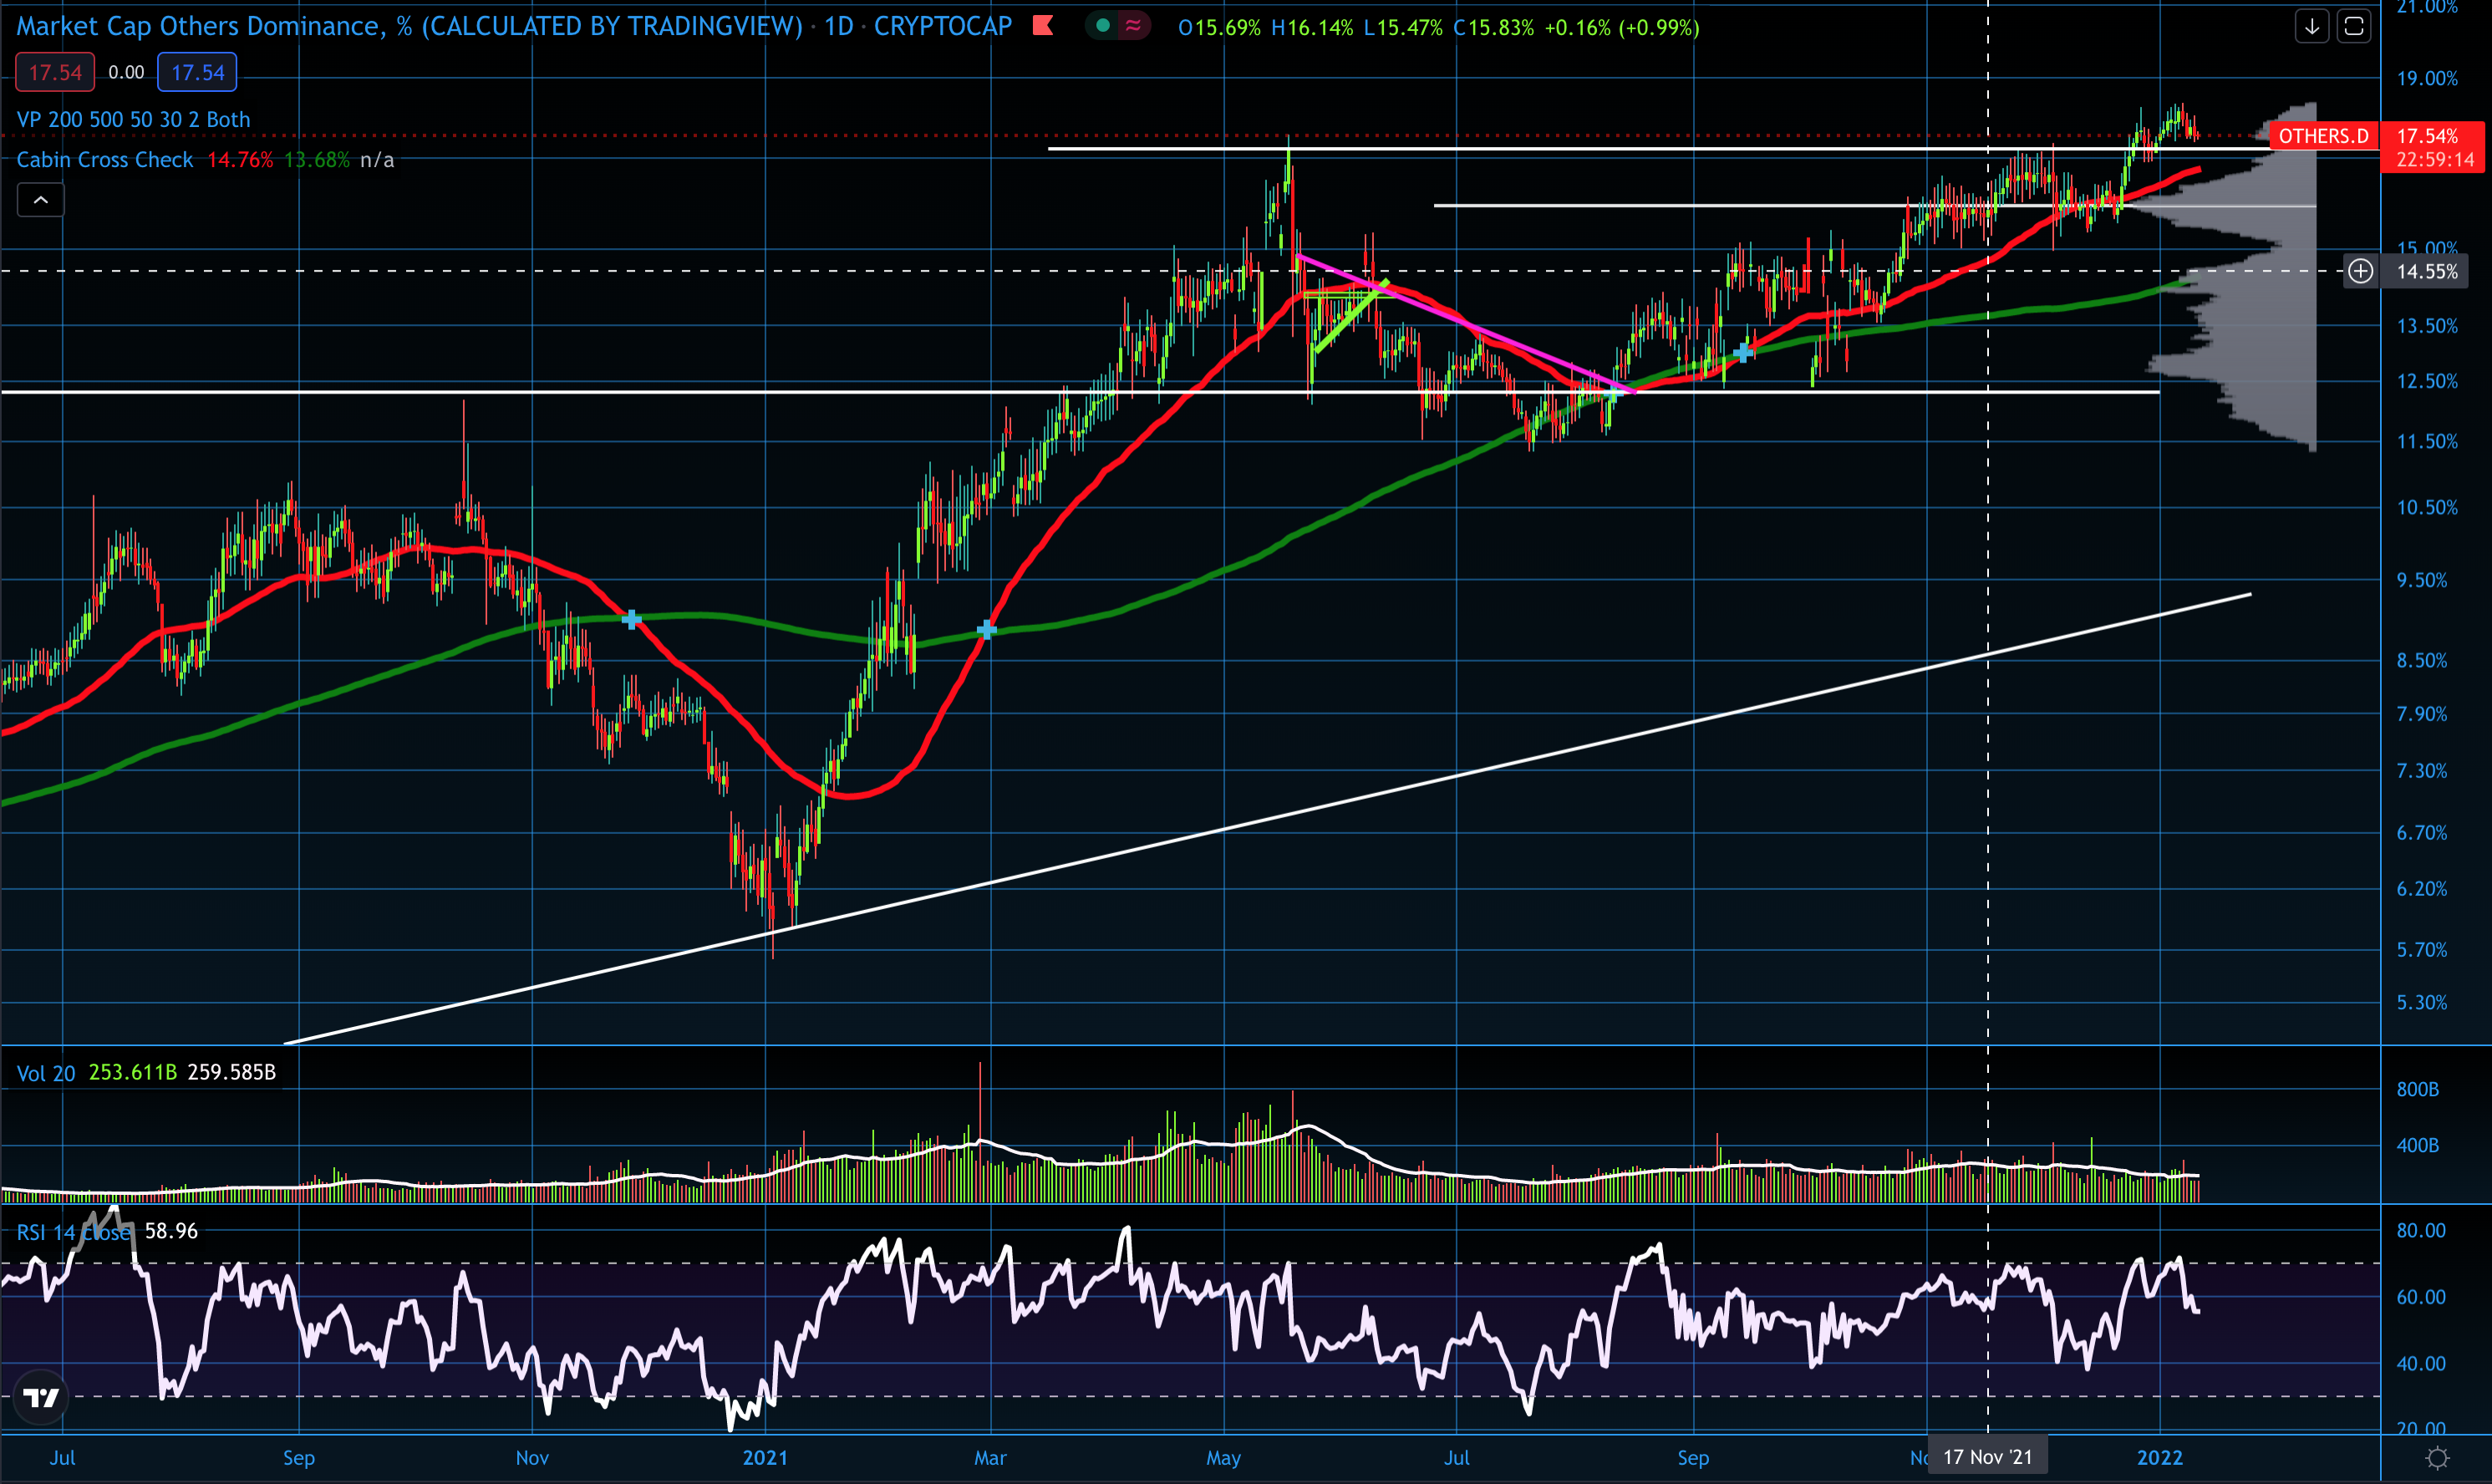
Low cap dominance is bullish. I mean, just look at the chart. It broke bullish and is retesting the second layer of breakout.
USDT.D
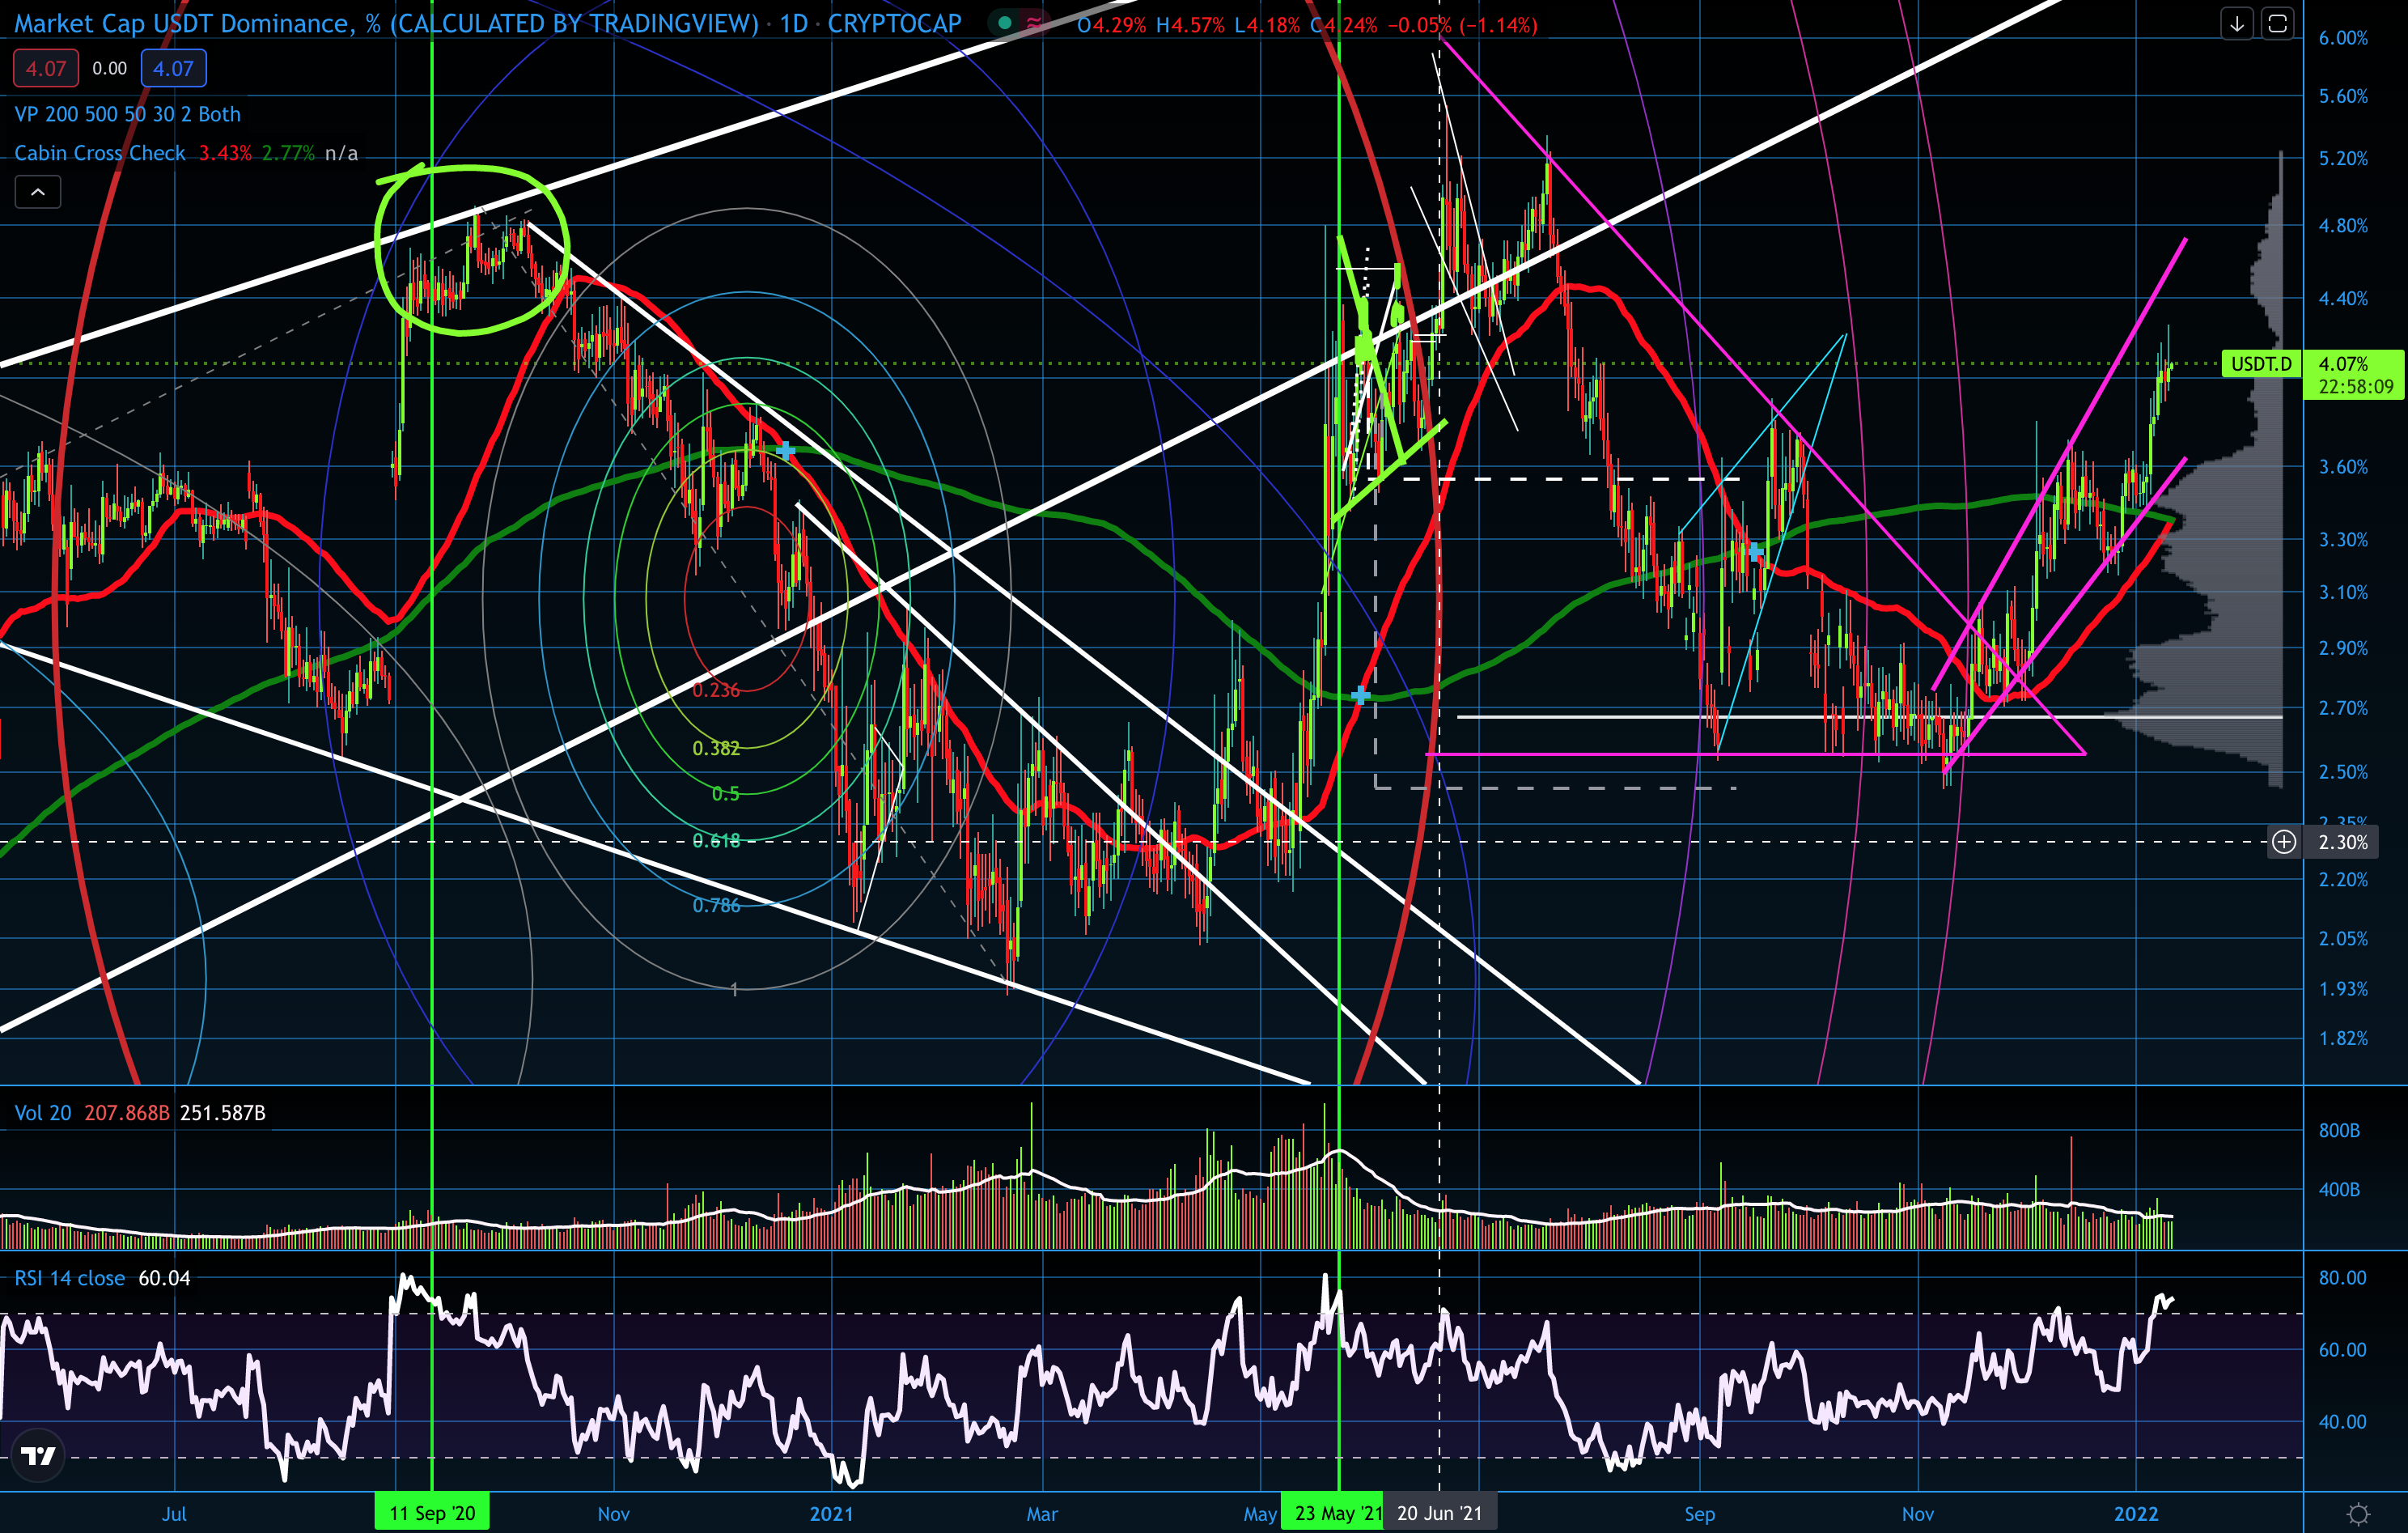
USDT.D is in a rising broadening wedge and a steep one at that. Can it keep the momentum at this rate sustained? Im not convinced as rising broadening wedges tend to break bearish. When USDT.D goes down, coins go up. USDT.D has been playing games with the market for well over a year now.
The DXY
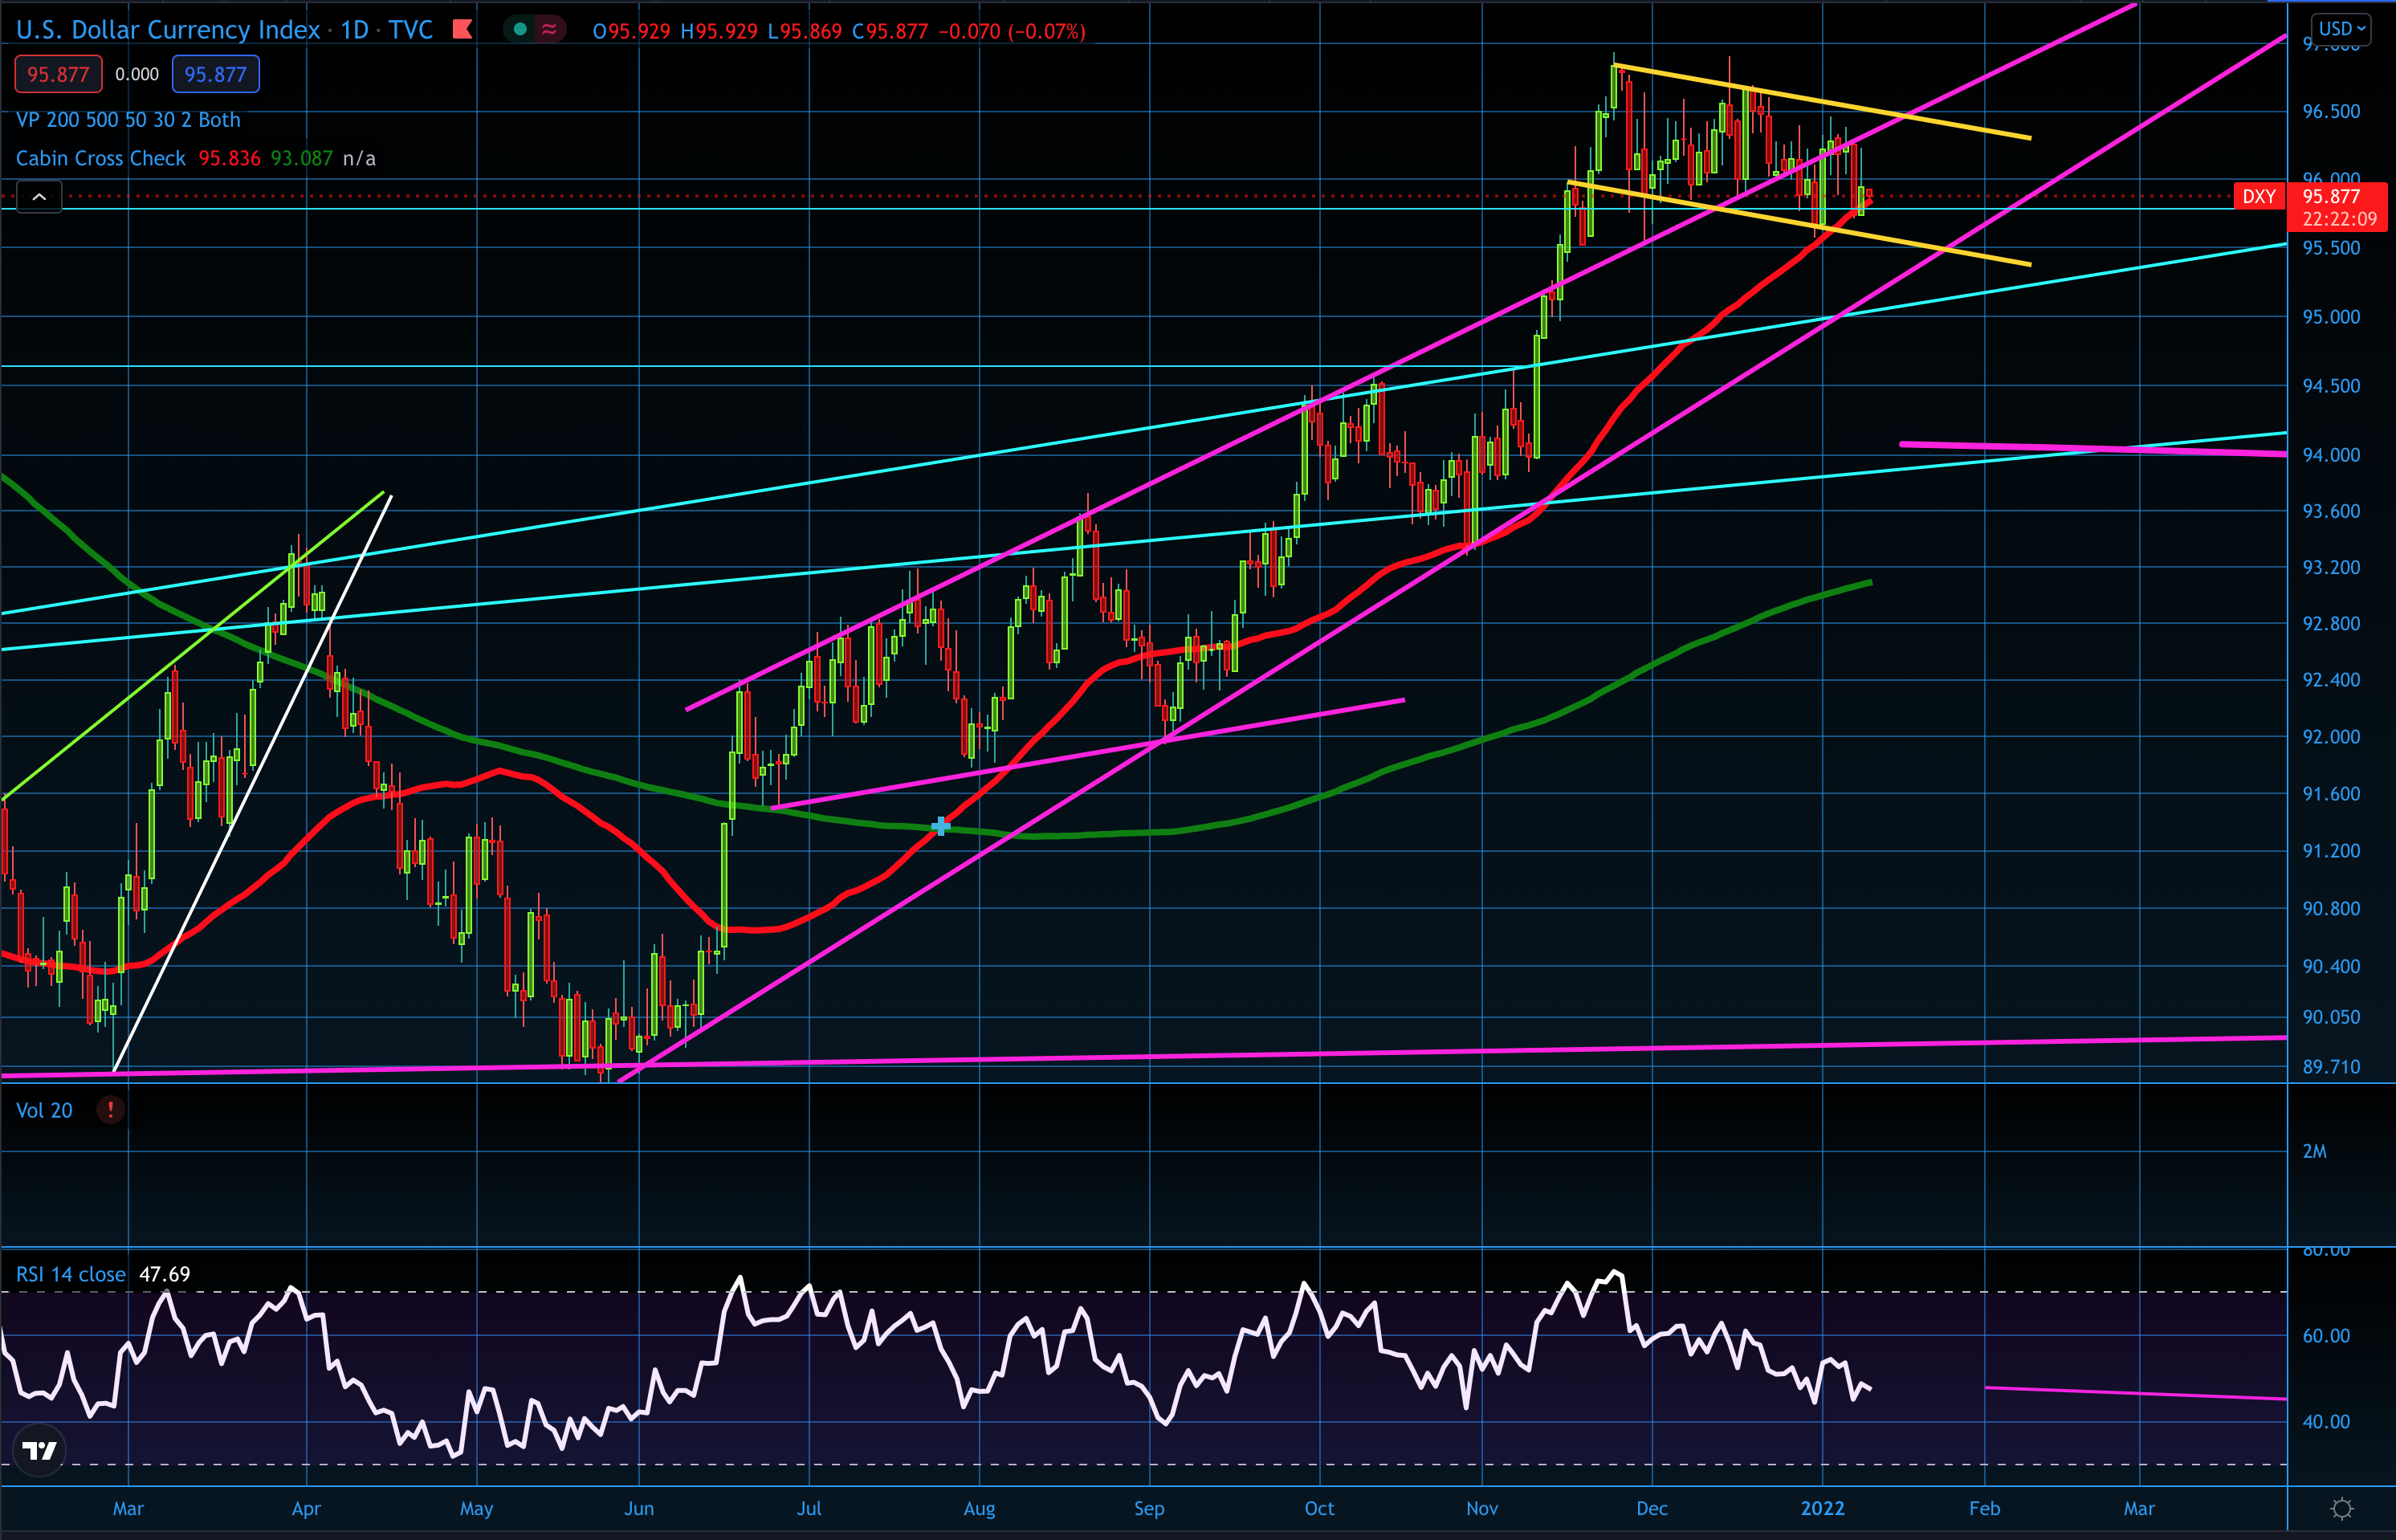
The DXY is showing a mixed signal it’s in a bull flag. However, it also has fallen back into its previous formation which is a rising wedge and a very bearish sign. The macro chart to me does not look good either, in fact it looks like hot garbage long term:
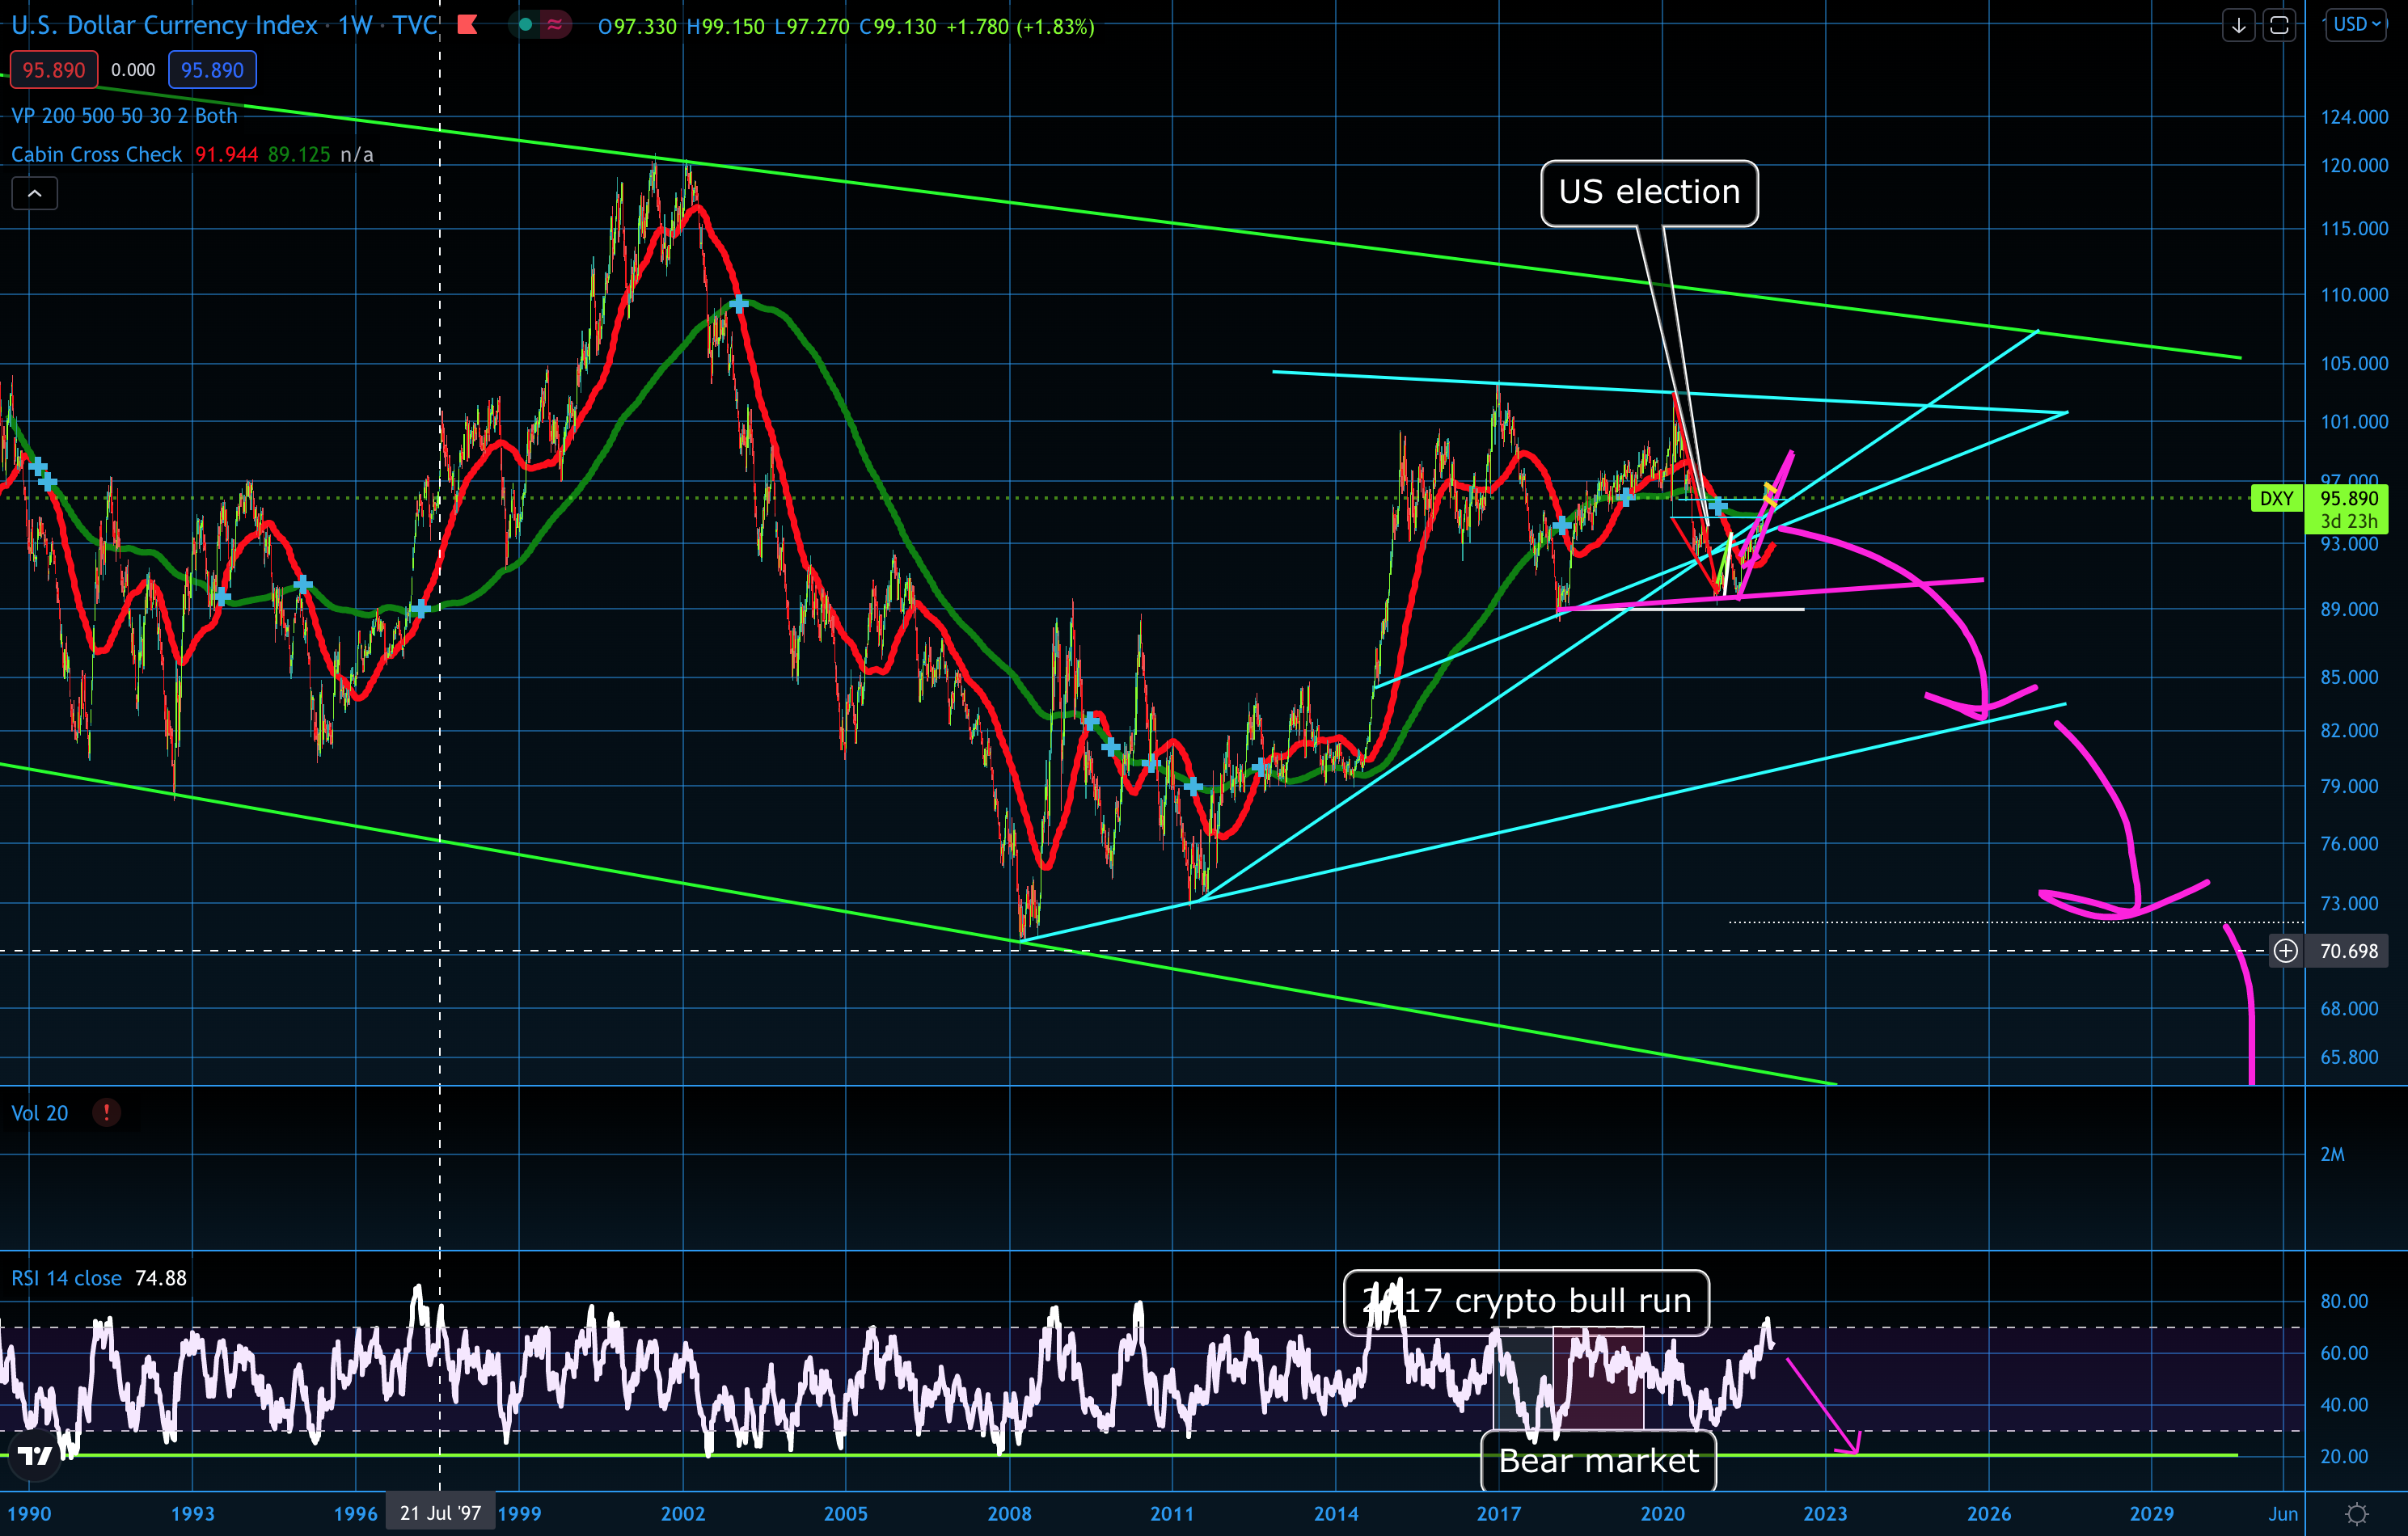
Add to this, we all know how much the US government has printed as of late, trillions. They claim they are going to raise interest rates but if they do, it would have negative consequences for the government. It also would not be the first time they say they are going to raise the rates and not actually do it. Look, everything the US government (and basically all western governments) are doing is trying to prop up sinking ships with fluff. How long can they keep it up? Note the RSI is running hot on the DXY. This looking like nature wants it to come down and when it does, crypto goes up.
Conclusion
Do all these bullish patterns fail and invalidate? From looking around on the charts, there are many signs that lead me to believe that the recent dips could be another fake out. It did destroy ALTs but remember that these ALTs can recover just as fast. As we approach the yellow bar on the BTCUSD/M1 chart, ALT’s start making good moves up. Once we pass it I believe we will see something like 2017 again. There is always a risk and a chance that it goes the other way so you want to have stop losses in place where needed, but don’t get caught selling when you should be buying.
The last months have been rough for all, but this market rewards those with patience.
Tags: ALGO, BOSON, BTC, DEFIPERP, dusk, ICX, SOV, TOTAL, TOTAL2Categorised in: Cryptocurrency Trading, Technical Analysis
This post was written by BlockAdvisor